Many stories have been about the upcoming “hyperactive” hurricane season predicted this year, but how accurate are these forecasts about the number of hurricanes each year?
Accurate hurricane forecasts have immense social and economic value. Improvements in merely forecasting the accuracy of hurricane wind speed have been estimated to “reduced hurricane costs – damages, recovery spending, and protective spending – by 19% or $5 billion per hurricane.”
Below we are going to look at two of the many hurricane forecasts:
- Colorado State University’s Tropical Meteorology Project
- National Weather Service’s Climate Prediction Center
Please note the following:
- This is about the number of North Atlantic hurricanes forecasted each year, not landfall or strength
- We’re only focusing on hurricanes in the North Atlantic, not tropical storms, named storms, Pacific hurricanes, or “major hurricanes” (a subset of hurricanes.)
- While both organizations make multiple forecasts throughout the year, we will primarily look at their respective forecasts from late May to early June, as June 1st is the official start of “hurricane season.”
- These are small sample sizes, and we shouldn’t construe too much.
Colorado State
Professor Bill Gray (1929-2016) was a pioneer of hurricane forecasting and founded the Tropical Meteorology Project at Colorado State University (CSU). He was the primary author of CSU’s forecast from 1984 through 2005 when he retired, and the forecast was then led by his protégé Phil Klotzbach.
Evolution of the Model
CSU has constantly tweaked its forecasting model, updating it with the newest available information and backtesting (or “hindcasting”) the model to see how well it performs against historical data. Below we’re going to walk through some, but definitely not all, of the model’s various iterations.
1984
From Gray’s initial (public) forecast in 1984:
The Atlantic experiences a larger seasonal variability of hurricane activity than any other global tropical cyclone basin. The number of hurricanes per season can be as high as 11 per season (as in 1950, 1916), 10 (1969, 1933), 9 (as in 1980, 1955), or as low as zero (as in 1914, 1907), 1 (as in 1919, 1905), or 2 (as in 1982, 1931, 1930, 1922, 1917, 1904). Until now there has been no objective and skillful method for indicating whether a coming hurricane season was going to be an active one or not. Recent research by the author (Gray, 1983) indicates that there are three atmospheric parameters (out of a large number studied) which have a reasonably high 4-6 month lag correlation with the following season’s hurricanes activity. If these three predictive parameters are used in combination, then it is possible to explain about half or more of the seasonal variability in Atlantic hurricane activity on a statistical multi-year basis.
The three predictors initially used were the following:
- El Nino (EN)
- Equatorial Stratospheric Quasi-Biennial-Oscillation (QBO) of east-west or zonal Wind
- Caribbean-Gulf of Mexico April-May Sea Level Pressure Anomaly (SLPA).
Millibar (mb): The standard unit of measurement for atmospheric pressure used by the National Weather Service. One millibar is equivalent to 100 newtons per square meter or .029 inches of Mercury. Standard surface pressure is 1013.2 millibars.
Predicted No. of Hurricanes = 6 + (QBO1+ QBO2) + EN + SLPA
QBO1 = 30 mb equatorial wind direction correction factor – if westerly add one, if easterly subtract one. Set to zero if zonal wind direction during the season is in a change over phase from east to west or west to east.
QBO2 = correction factor for change in 30 mb equatorial zonal winds (u) during the hurricane season – if uniformally increasing westerly (positive au/at) then add one, if uniformally decreasing westerly (negative au/at) then subtract one. Set to zero if there is a change of sign of
au/at during the season. The total QBO correction represents the sum of QBO, and QBO, and varies between + 2.
EN = El Nino influence. If present subtract two for a moderate El Nino event, four for a strong El Nino event, otherwise set to zero.
SLPA = average SLPA for April-May, from the Caribbean-Gulf of Mexico stations. Add one or two if SLPA is is < -0.4 mb or < -0.8 mb respectively. Subtract one or two if SLPA is 0.4-0.8 mb or > 0.8 mb respectively. Make no correction for SLPA between -0.4 and 0.4 mb. Do not accept any pressure correction greater or less than + 2.
Special Correction. If [the above model] should indicate a value less than three during an El Nino year, then disregard and make a seasonal forecast for at least three hurricanes. If Eq. 1 indicates a value less than four for a non-El Nino year, then disregard and make the forecast for four hurricanes.
1985
The next year he added a parameter, 200 mb Zonal Wind Anomaly (ZWA):
Predicted No. of Hurricanes = 6 + (QBO1+ QBO2) + EN + SLPA + ZWA
A study of hurricane frequency over the 35-year period of 1950-1984 shows that Atlantic hurricane activity is also associated with late spring and early summer upper tropospheric west to east zonal wind velocities at the low latitude Caribbean Sea stations of Balboa, C.Z. (9°N), San Andres (12.5°N), Curacao (12°N), Trinidad (10.5°N) and Barbados (13°N). Stronger than average 200 mb (12 km or 40,000 ft level) winds from the west are associated with fewer hurricanes. By contrast, hurricane activity is more prevalent when early summer 200 mb winds at these stations are weaker than average from the west or stronger than average from the east. It is the June-July wind which are related to cyclone activity. These winds are not used for the 1 June forecast but assist with the 1 August updated forecast.
1988
In 1988, Gray added a “Memory” (MEM) parameter:
Predicted No. of Hurricanes = (AVG) + (QBO + EN + SLPA + ZWA + MEM)
MEMORY correction term from last 5 years August-September values of SLPA and ZWA. Subtract or add one if the last 5 years August-September SLPA and ZWA have been significantly above or below average.
Memory was removed from the numeric model in the following year but kept in the model of hurricane destructive potential (HDP).
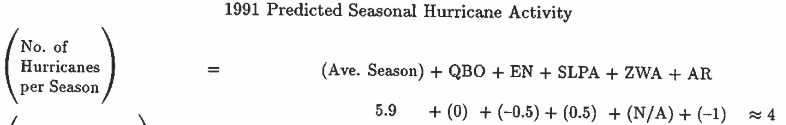
1991
The early 1990s brought several changes to Gray’s model. In 1991, a new parameter was added:
African Rainfall (AR) is a new forecast parameter which we are now including in the forecast for the second time. Atlantic intense hurricane activity is much enhanced when the Sahel region of West Africa … has above average summer precipitation and much suppressed when precipitation in this region is below average…show that nearly 60 percent of the year to year variance in the seasonal number of Atlantic intense hurricane days over the last 42 years can be explained by West Africa rainfall amounts prior to 1 August. Analyses of conditions through May 1991 indicate that Western Sahel precipitation will be below normal this year; this trend should lead to a significant reduction in this year’s intense hurricane activity.
1992
In 1992, a SLPA and ZWA were replaced with △PT:
West Africa west to east surface pressure and temperature gradients (△PT). Recent research is showing that west to east surface pressure and surface temperature gradients across West Africa from February through May are strongly correlated with the hurricane activity which follows later in the year. We find that Atlantic hurricane activity is enhanced when the [east minus west] pressure gradient is higher than normal and/or when the east minus west temperature gradient anomaly is below average. Pressure and temperature gradients between February and May of this year were such as to indicate a below average hurricane season.
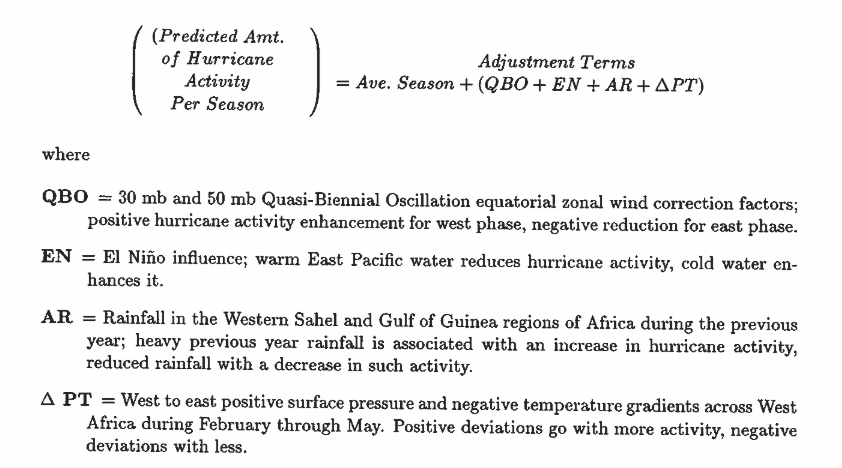
1993
The model was updated in 1993 with additional parameters and now explained 62% of the variance in the number of seasonal hurricanes:
Here is the equation above with the variable and coefficient values plugged in:
9.024027635 =
9.7544 + 0.1389(1.000*-2 + -0.3662*-4 + -2.1072*2)
+ 0.5074(1.000*-0.95 + 0.5335*-0.90 + -1.3485*-0.65 + 0.8690*-0.20)
+-2.5884(1.000*-0.90 + 0.0667*0.5 + -0.0012*145 + 0.0016*125 + -0.0521*-11.5 + 0.0631*2)
Despite the model producing a forecast of 9 hurricanes in 1993, Gray made qualitative adjustments and forecasted 7 hurricanes based on his belief that the El Nino conditions used in the model were not representative of El Nino conditions expected later in the year. There were four hurricanes that year.
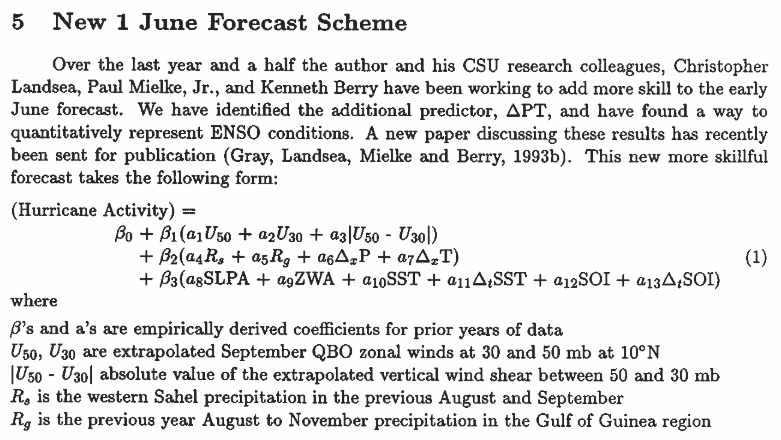
1997
In 1997, the forecast took a different shape. Using the June forecast below, 17 potential predictors were tested and the combination that performed the best on the historical data from 1950 to 1995 was used for each of CSU’s models.
The Hurricane model took six of the parameters above:
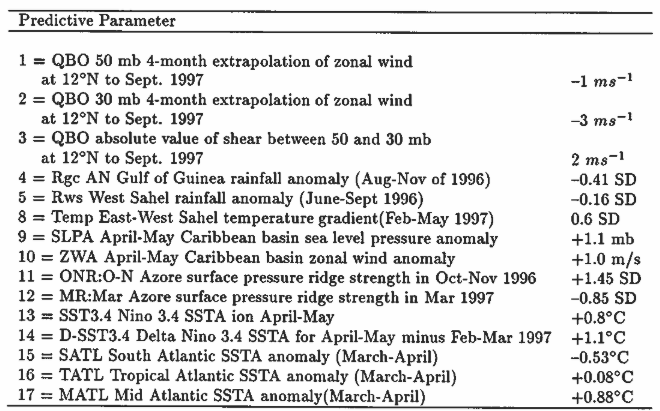
- QBO 50 mb 4-month extrapolation (1)
- QBO absolute value of shear (3)
- Rgc AN Gulf of Guinea rainfall anomaly (4)
- Rws West Sahel rainfall anomaly (5)
- ONR: O-N Azore surface pressure ridge strength (11)
- MATL Mid Atlantic SSTA anomaly (17)
Those six predictors explained 53.2% of the historical variance and predicted 6.47 hurricanes in 1997. The final adjusted June forecast was 7 and the August forecast called for 8 hurricanes. The actual number of hurricanes in 1997 was three.
2002
The next major change came in 2002:
African rainfall was a very strong and reliable predictor prior to 1995. But African rainfall has not worked for predicting TCs since 1995; very active hurricane conditions have occurred with low values of measured African rainfall during this recent period which is opposite the association observed during the prior 45 years of measurement. We have also made a statistical forecast assuming average African rainfall conditions of last year. This would be more in keeping with the active 2001 hurricane season which occurred. We believe this is more typical of what we should see this year. Column 2 gives our prediction [assuming] that African rainfall were normal. Note that this statistical forecast substantially raises our prediction. Our statistical scheme had been heavily weighted to this parameter.
The June forecast with “dry” African rainfall called for 3.2 hurricanes, while the model with average African rainfall conditions predicted 5.5. The adjusted forecast for June was six, which was downgraded to four in the August forecast; there were four hurricanes in 2002.
2006
In 2006, after the June forecasts had “consistently under-predicted Atlantic basin hurricane activity,” CSU updated its methodology to use only four predictors but with more recent data from that spring:
- May Sea Surface Temperatures (SST) in the Eastern Equatorial Pacific
- April-May SST off the Northwestern European Coast
- March-April Low sea level pressure (SLP) in the Tropical Atlantic
- Previous November 500 MB Geopotential Height in the far North Atlantic
The new model forecasted 6.7 hurricanes. A look back at the years with the most analogous conditions saw an average of 8.8 hurricanes over those four years. The final adjusted forecast for June 2006 was nine and downgraded to seven in the August forecast; there were five hurricanes that year.
2008
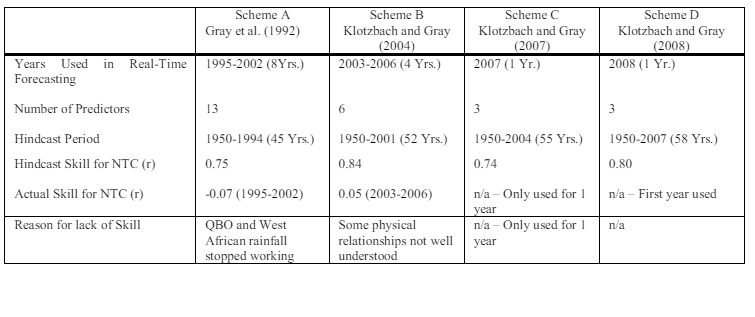
After two years of more struggles, CSU tried another new scheme in 2008 that combined the previous forecast with the current predictors to predict Net Tropical Cyclone (NTC) activity.
NTC is the average seasonal percentage mean of the number of tropical storms (NS), the number of hurricanes (H), the number of major hurricanes (IH), Named Storm Days (NSD), Hurricane Days (HD) and major hurricane days (IHD). NTC gives an overall indication of Atlantic basin seasonal hurricane activity. The 1950-2000 average value of this parameter is 100.
NTC = (%NS + %H + %IH + %NSD + %HD + %IHD) / 6
The two predictors used were:
- Subtropical Atlantic Index (+): April-May SST (20-50°N, 15-30°W) (+) & May SLP (10-35°N, 10-40°W) (-)
- April-May 200 MB U in the South Indian Ocean (-)
This new early June forecast scheme was created to overcome the lack of forecast skill that we have demonstrated over the last 13 years and especially the last four seasons of 2004-2007.
…
The forecast is created by combining the two April-May predictors using least squared linear regression over the period from 1950-2007. The resulting hindcasts were then ranked in order from 1 (the highest value) to 58 (the lowest value).
…
This scheme only predicts Net Tropical Cyclone (NTC) activity, and the other seasonal predictors are then derived from this NTC prediction. These other seasonal predictors are calculated by taking the observed historical relationship between themselves and NTC.
The final NTC hindcast value was obtained by taking the final June NTC hindcast rank and assigning the observed NTC value for that rank. For example, if the final June NTC hindcast rank was 10 (the 10th highest rank), the NTC value assigned for the prediction would be the 10th highest observed rank, which in this case would be 166 NTC units. Final hindcast values are constrained to be between 40 and 200 NTC units.
…
This scheme only predicts Net Tropical Cyclone (NTC) activity, and the other seasonal predictors are then derived from this NTC prediction.
The most analogous years to the 2008 hurricane season were 1951 (8), 1961 (8), 2000 (8), and 2001 (9). The qualitative adjustment was based on multiple factors indicating an above-average season.
The June 2008 model predicted 7 hurricanes, while the analogous seasons averaged 8.3. The final adjusted forecast was for 8 hurricanes. The August forecast increased to 9, and there were 8 hurricanes that year.
2016
In 2016, NTC was replaced with the Accumulated Cyclone Energy (ACE) index but the ranking method remained. ACE is “A measure of a named storm’s potential for wind and storm surge destruction defined as the sum of the square of a named storm’s maximum wind speed (in 104 knots2) for each 6-hour period of its existence. The 1950-2000 average value of this parameter is 96 for the Atlantic basin.”
Using ACE as a predictor, the April, June, and August 2016 forecasts all called for six hurricanes and there were seven that year. In the long run, this change seems to be paying off. In the past 8 years (2016-2023), the August CSU forecast has been within two of the actual number, while the June forecast has been that close in six of eight years.
Numeric Forecast
| Year | Actual | CSU April | CSU June | CSU Aug | AVG | RANDOM (4-10) | Naïve Previous |
| 2023 | 7 | 6 | 7 | 9 | 7.2 | 4 | 8 |
| 2022 | 8 | 9 | 10 | 8 | 7.2 | 7 | 7 |
| 2021 | 7 | 8 | 8 | 8 | 7.2 | 6 | 14 |
| 2020 | 14 | 8 | 9 | 12 | 6.4 | 10 | 6 |
| 2019 | 6 | 5 | 6 | 7 | 6.4 | 5 | 8 |
| 2018 | 8 | 7 | 6 | 5 | 5.9 | 7 | 10 |
| 2017 | 10 | 4 | 6 | 8 | 5.9 | 9 | 7 |
| 2016 | 7 | 6 | 6 | 6 | 5.9 | 9 | 4 |
| 2015 | 4 | 3 | 3 | 2 | 5.9 | 5 | 6 |
| 2014 | 6 | 3 | 4 | 4 | 5.9 | 8 | 2 |
| 2013 | 2 | 9 | 9 | 8 | 5.9 | 8 | 10 |
| 2012 | 10 | 4 | 5 | 6 | 5.9 | 7 | 7 |
| 2011 | 7 | 9 | 9 | 9 | 5.9 | 8 | 12 |
| 2010 | 12 | 8 | 10 | 10 | 5.9 | 10 | 3 |
| 2009 | 3 | 6 | 5 | 4 | 5.9 | 6 | 8 |
| 2008 | 8 | 8 | 8 | 9 | 5.9 | 9 | 6 |
| 2007 | 6 | 9 | 9 | 8 | 5.9 | 4 | 5 |
| 2006 | 5 | 9 | 9 | 7 | 5.9 | 8 | 15 |
| 2005 | 15 | 7 | 8 | 11 | 5.9 | 5 | 9 |
| 2004 | 9 | 8 | 8 | 7 | 5.9 | 8 | 7 |
| 2003 | 7 | 8 | 8 | 10 | 5.9 | 7 | 4 |
| 2002 | 4 | 7 | 6 | 4 | 5.9 | 6 | 9 |
| 2001 | 9 | 6 | 7 | 7 | 5.8 | 6 | 8 |
| 2000 | 8 | 7 | 8 | 7 | 5.8 | 5 | 9 |
| 1999 | 8 | 9 | 9 | 9 | 5.8 | 9 | 10 |
| 1998 | 10 | 6 | 6 | 6 | 5.8 | 4 | 3 |
| 1997 | 3 | 7 | 7 | 8 | 5.8 | 8 | 9 |
| 1996 | 9 | 7 | 6 | 9 | 5.7 | 7 | 11 |
| 1995 | 11 | 6 | 8 | 10 | 5.7 | 10 | 3 |
| 1994 | 3 | — | 5 | 4 | 5.7 | 4 | 4 |
| 1993 | 4 | — | 7 | 6 | 5.7 | 4 | 4 |
| 1992 | 4 | — | 4 | 4 | 5.9 | 10 | 4 |
| 1991 | 4 | — | 4 | 3 | 5.9 | 7 | 8 |
| 1990 | 8 | — | 7 | 7 | 5.8 | 6 | 7 |
| 1989 | 7 | — | 4 | 4 | 6 | 4 | 5 |
| 1988 | 5 | — | 7 | 7 | 6 | 8 | 3 |
| 1987 | 3 | — | 5 | 4 | 6 | 4 | 4 |
| 1986 | 4 | — | 4 | 5 | 6 | 7 | 7 |
| 1985 | 7 | — | 8 | 8 | 6 | 6 | 5 |
| 1984 | 5 | — | 7 | 7 | 6 | 9 | 3 |
Below is the root mean square error (RMSE) for the forecasts; lower is more accurate. For a baseline, we’re including random numbers between 4 and 10, as well as two naïve forecasts: the number of hurricanes in the prior year and the average number of hurricanes used in the forecast itself.
Comparing forecasts from 1984 to 2023 shows us that CSU outperformed the naïve forecast, but was only slightly more accurate than random numbers between 4 and 10:
| Forecast | RMSE |
| CSU June | 2.80 |
| CSU August | 2.27 |
| Random (4-10) | 3.15 |
| Naïve Prior | 4.32 |
| Naïve AVG | 3.12 |
However, if we only look at the past two decades, 2004 to 2023, all the forecasts scored worse and the random number generator slightly outperformed CSU:
| Forecast | RMSE |
| CSU April | 3.82 |
| CSU June | 3.29 |
| CSU August | 2.47 |
| Random (4-10) | 3.26 |
| Naïve Prior | 5.05 |
| Naïve AVG | 3.61 |
We should acknowledge two points: first, this is treating several different models as a single forecast. Second, these are small sample sizes. Third, from the very first forecast (pp.28-32), Gray discusses forecast error and probability distribution, and the current CSU forecasts include uncertainty ranges, even if the single numeric forecast is what the media report. Now we’re going to take a less rigid look at the forecasts.
Qualitative Forecasts
Now here is how the CSU model performed relative to the average the model was working off of. “AVG” is the average number of hurricanes used in the model; it varies depending on the period used. “June Qualitative Forecast” is how the June forecast described the number of hurricanes with words taken verbatim. “Correct” is whether the forecast description was accurate; this is admittedly arbitrary on some level but this will attempt to interpret the forecast literally.
In general, the June qualitative forecasts were very accurate by being correct 70% of the time (28/40):
| Year | Actual | June numeric | AVG | June Qualitative Forecast | Correct | Date |
| 2023 | 7 | 7 | 7.2 | near-average | Yes | 6/1/2023 |
| 2022 | 8 | 10 | 7.2 | well above-average | Yes | 6/2/2022 |
| 2021 | 7 | 8 | 7.2 | above-average | Yes | 6/3/2021 |
| 2020 | 14 | 9 | 6.4 | well above-average | Yes | 6/4/2020 |
| 2019 | 6 | 6 | 6.4 | average | Yes | 6/4/2019 |
| 2018 | 8 | 6 | 6.5 | average | Yes | 5/31/2018 |
| 2017 | 10 | 6 | 6.5 | average | No | 6/1/2017 |
| 2016 | 7 | 6 | 6.5 | average | Yes | 6/1/2016 |
| 2015 | 4 | 3 | 6.5 | well below-average | Yes | 6/1/2015 |
| 2014 | 6 | 4 | 6.5 | below-average | Yes | 6/2/2014 |
| 2013 | 2 | 9 | 6.5 | above-average | No | 6/3/2013 |
| 2012 | 10 | 5 | 6.5 | slightly below-average | No | 6/1/2012 |
| 2011 | 7 | 9 | 5.9 | well above-average | Yes | 6/1/2011 |
| 2010 | 12 | 10 | 5.9 | much more active than the average | Yes | 6/2/2010 |
| 2009 | 3 | 5 | 5.9 | slightly below-average | Yes | 6/2/2009 |
| 2008 | 8 | 8 | 5.9 | above-average | Yes | 6/3/2008 |
| 2007 | 6 | 9 | 5.9 | much more active than the average | No | 5/31/2007 |
| 2006 | 5 | 9 | 5.9 | much more active than the average | No | 5/31/2006 |
| 2005 | 15 | 8 | 5.9 | well above-average | Yes | 5/31/2005 |
| 2004 | 9 | 8 | 5.9 | above-average | Yes | 5/28/2004 |
| 2003 | 7 | 8 | 5.9 | above-average | Yes | 5/30/2003 |
| 2002 | 4 | 6 | 5.9 | near average | Yes | 5/31/2002 |
| 2001 | 9 | 7 | 5.8 | above average | Yes | 6/7/2001 |
| 2000 | 8 | 8 | 5.8 | above average | Yes | 6/7/2000 |
| 1999 | 8 | 9 | 5.8 | above average | Yes | 6/4/1999 |
| 1998 | 10 | 6 | 5.8 | near average | No | 6/5/1998 |
| 1997 | 3 | 7 | 5.8 | above average | No | 6/6/1997 |
| 1996 | 9 | 6 | 5.7 | average | No | 6/6/1996 |
| 1995 | 11 | 8 | 5.7 | above average | Yes | 6/7/1995 |
| 1994 | 3 | 5 | 5.7 | below average | Yes | 6/7/1994 |
| 1993 | 4 | 7 | 5.7 | about an average season | No | 6/4/1993 |
| 1992 | 4 | 4 | 5.9 | below average | Yes | 6/5/1992 |
| 1991 | 4 | 4 | 5.9 | below average | Yes | 6/5/1991 |
| 1990 | 8 | 7 | 5.8 | somewhat above the average | Yes | 6/5/1990 |
| 1989 | 7 | 4 | 6 | below average | No | 5/26/1989 |
| 1988 | 5 | 7 | 6.0 | above average | No | 5/26/1988 |
| 1987 | 3 | 5 | 6 | slightly below average | Yes | 5/28/1987 |
| 1986 | 4 | 4 | 6 | below average | Yes | 5/29/1986 |
| 1985 | 7 | 8 | 6 | above average | Yes | 5/28/1985 |
| 1984 | 5 | 7 | 6 | slightly above normal | No | 5/24/1984 |
Please remember that the average used above changes depending on the period used. For example:
- 1947-1987 (6)
- 1950-1990 (5.7)
- 1950-2000 (5.9)
- 1981-2010 (6.4)
- 1991-2020 (7.2)
National Weather Service
In 1870, President Grant signed into the law the creation of the U.S. Army Signal Service’s Division of Telegrams and Reports for the Benefit of Commerce “to provide for taking meteorological observations at the military stations in the interior of the continent, and at other points in the States and Territories…and for giving notice on the northern lakes and on the seacoast, by magnetic telegraph and marine signals, of the approach and force of storms.”
In 1890, Congress passed President Benjamin Harrison’s proposal that meteorological responsibilities be transferred from the U.S. Army to a new U.S. Weather Bureau in the Department of Agriculture.
The National Oceanic and Atmospheric Administration (NOAA) was founded in 1970 based on a proposal from President Richard Nixon, although it contains several agencies that had existed long before its formation; this includes the U.S. Weather Bureaus which is now renamed the National Weather Service (NWS). Internal Nixon administration politics led NOAA to be part of the Commerce Department, rather than the Interior, where it still resides today.
1999
NWS started publishing biannual (May and August) hurricane forecasts in 1999 through its Climate Prediction Center (CPC), National Hurricane Center (NHC), and Hurricane Research Division (HRD). This first hurricane forecast was qualitative (“above average” activity) with no range or estimate of the number.
2000
By the next year, NWS was using ACE in its model and providing numeric estimates in its forecast:
One overall measure of seasonal activity is the Accumulated Cyclone Energy (ACE) index, which is calculated by taking the sum of the squares of the estimated 6-hourly maximum sustained wind speed (in units of m/s) for all systems while they are at least tropical storm strength. The ACE index implicitly accounts for the number of tropical storms and hurricanes, as well as their duration, giving more weight to stronger systems. Thus, it is a robust measure of overall activity and does not suffer the shortcomings inherent in attempting to determine the relative activity of a particular season purely by the number of tropical storms or hurricanes alone. This index is a slight modification of the Hurricane Destruction Potential (HDP) index used By Dr. William Gray and colleagues at the Colorado State University, in that the ACE index also includes systems while at tropical storm intensity. The ACE index, combined with independent numbers of named storms, etc. provides a method by which one can partition between active, near-average, and inactive hurricane years.
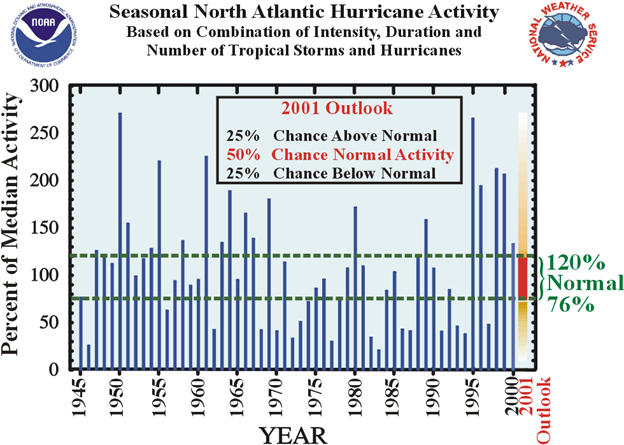
Background Information: May 2000
With this forecast of an above-average hurricane season, it is reasonable to expect 11 or more tropical storms, 7 or more hurricanes and 3 or more major hurricanes.
NOAA: 2000 Atlantic Hurricane Outlook (August 2000)
2001
The 2001 NWS forecast begins providing ranges and probabilities:
Our forecast is for a 50% chance of normal levels of activity during the 2001 Atlantic hurricane season, a 25% chance of above-normal activity and a 25% chance of below-normal activity…Thus, while it is reasonable to expect 8-11 tropical storms, 5-7 hurricanes and 2-3 major hurricanes this season, the season can certainly feature normal levels of activity without all three of these criteria being met. [Emphasis in original.]
2009
From 2009 onward, NWS gives a 70% probability for the range of expected hurricanes, which is in line with their forecast accuracy:
| Year | Actual | May Low | May High | Forecast | Aug Low | Aug High | Forecast |
| 2024 | 8 | 13 | 5/23/2024 | ||||
| 2023 | 7 | 5 | 9 | 5/25/2023 | 6 | 11 | 8/10/2023 |
| 2022 | 8 | 6 | 10 | 5/24/2022 | 6 | 10 | 8/4/2022 |
| 2021 | 7 | 6 | 10 | 5/20/2021 | 7 | 10 | 8/4/2021 |
| 2020 | 14 | 6 | 10 | 5/21/2020 | 7 | 11 | 8/6/2020 |
| 2019 | 6 | 4 | 8 | 5/23/2019 | 5 | 9 | 8/8/2019 |
| 2018 | 8 | 5 | 9 | 5/24/2018 | 4 | 7 | 8/9/2018 |
| 2017 | 10 | 5 | 9 | 5/25/2017 | 5 | 9 | 8/9/2017 |
| 2016 | 7 | 4 | 8 | 5/27/2016 | 5 | 8 | 8/11/2016 |
| 2015 | 4 | 3 | 6 | 5/27/2015 | 1 | 4 | 8/6/2015 |
| 2014 | 6 | 3 | 6 | 5/22/2014 | 3 | 6 | 8/7/2014 |
| 2013 | 2 | 7 | 11 | 5/23/2013 | 6 | 9 | 8/8/2013 |
| 2012 | 10 | 4 | 8 | 5/24/2012 | 5 | 8 | 8/9/2012 |
| 2011 | 7 | 6 | 10 | 5/19/2011 | 7 | 10 | 8/4/2011 |
| 2010 | 12 | 8 | 14 | 5/27/2010 | 8 | 12 | 8/5/2010 |
| 2009 | 3 | 4 | 7 | 5/21/2009 | 3 | 6 | 8/6/2009 |
| 2008 | 8 | 6 | 9 | 5/22/2008 | 7 | 10 | 8/7/2008 |
| 2007 | 6 | 7 | 10 | 5/22/2007 | 7 | 9 | 8/9/2007 |
| 2006 | 5 | 8 | 10 | 5/22/2006 | 7 | 9 | 8/8/2006 |
| 2005 | 15 | 7 | 9 | 5/16/2005 | 9 | 11 | 8/2/2005 |
| 2004 | 9 | 6 | 8 | 5/17/2004 | 6 | 9 | 8/10/2004 |
| 2003 | 7 | 6 | 9 | 5/19/2003 | 7 | 9 | 8/7/2003 |
| 2002 | 4 | 6 | 8 | 5/20/2002 | 4 | 6 | 8/8/2002 |
| 2001 | 9 | 5 | 7 | 5/21/2001 | 6 | 8 | 8/9/2001 |
| 2000 | 8 | 7 | 5/10/2000 | 7 | 8/10/2000 | ||
| 1999 | 8 | 5/27/1999 | 8/10/1999 |
Each of the May and August forecast ranges from 2009 to 2023 had a hit rate of 67% (10/15) of the time
Taking a step back, and looking at all forecasts from 2001 to 2023, the picture gets fuzzier. Both the May and August forecast ranges captured the actual number of hurricanes in 57% (13/23) of years. But at the same time, these 23 years encompass different models and different probabilities year to year.
Conclusion
The forecasts are pretty accurate if we think of them as a range or relative forecast rather than a finite number of hurricanes.
Both May and August NWS forecasts were well-calibrated from 2009 onward. Interestingly, they didn’t improve from May to August.
The CSU April numeric forecasts were less accurate than the average, while the June forecasts were roughly the same as a random number generator. However, the model gains accuracy over the calendar year, and the August forecast shows skill over the naïve forecasts.
While “hurricane season” technically begins in June, North Atlantic hurricanes are unlikely to occur until August. Recorded hurricanes (1851-2022) have rarely happened before June; less than one percent will occur between January and May of any year. And June and July only account for roughly 9% of all hurricanes. Over 84% of all hurricanes have occurred in August, September or October.
Why predict the number of hurricanes, rather than just a qualitative forecast, when the numeric forecasts (specifically April and June) are roughly the same as guessing far out? CSU answers this question for us:
Why issue extended-range forecasts for seasonal hurricane activity?
We are frequently asked this question. Our answer is that it is possible to say something about the probability of the coming year’s hurricane activity which is superior to climatology. The Atlantic basin has the largest year-to-year variability of any of the global tropical cyclone basins. People are curious to know how active the upcoming season is likely to be, particularly if you can show hindcast skill improvement over climatology for many past years.
Everyone should realize that it is impossible to precisely predict this season’s hurricane activity in early June. There is, however, much curiosity as to how global ocean and atmosphere features are presently arranged with regards to the probability of an active or inactive hurricane season for the coming year. Our early June statistical and statistical/dynamical hybrid models show strong evidence on ~25–40 years of data that significant improvement over a climatological forecast can be attained. We would never issue a seasonal hurricane forecast unless we had models developed over a long hindcast period which showed skill. We also now include probabilities of exceedance to provide a visualization of the uncertainty associated with these predictions.
We issue these forecasts to satisfy the curiosity of the general public and to bring attention to the hurricane problem. There is a general interest in knowing what the odds are for an active or inactive season. One must remember that our forecasts are based on the premise that those global oceanic and atmospheric conditions which preceded comparatively active or inactive hurricane seasons in the past provide meaningful information about similar trends in future seasons.
It is also important that the reader appreciate that these seasonal forecasts are based on statistical and dynamical models which will fail in some years. Moreover, these forecasts do not specifically predict where within the Atlantic basin these storms will strike. The probability of landfall for any one location along the coast is very low and reflects the fact that, in any one season, most U.S. coastal areas will not feel the effects of a hurricane no matter how active the individual season is.
[Emphasis added]
This is a perfectly reasonable explanation. The public is interested in knowing what will happen, and so the tropical storm forecasters are simply meeting the demand for information, in a format the public can consume.
And where a hurricane will be is a significantly more important question than how many will occur. Forecasters have a good, and improving, track record at predicting this.
Overall, it’s amazing how little we know about hurricanes and weather in general. And it needs to be acknowledged that what little we do know today is largely because of Bill Gray.
Further analysis
- Other scoring rules for measuring accuracy.
- How well did Gray’s original model, and early models in general, perform after they were discarded for other schemes?
- It would be interesting to compare the various expert forecasts with markets on hurricanes:
- University of Miami Hurricane Futures Market (2005-2007)
- CRUCIAL Atlantic Hurricane Market 2024 (CAHM24)
For further information
Atlantic Hurricane Season – Wikipedia
Colorado State Current Forecast
Colorado State Forecast Archive
NWS Forecast Archive
National Weather Service History
Seasonal Hurricane Predictions
Hurricane Glossary
The Skeptic