The Commodity Futures Trading Commission (CFTC) recently held a public meeting to discuss proposed rules regarding event contracts. Under current regulations, there are only a few enumerated restrictions on contracts, including war, terrorism, and assassination.
Those three restrictions were mentioned repeatedly during the two-hour meeting, reminding one of the apocryphal story about former Secretary of State Henry Kissinger requesting “betting odds” from the CIA. However, it turns out that story is true.
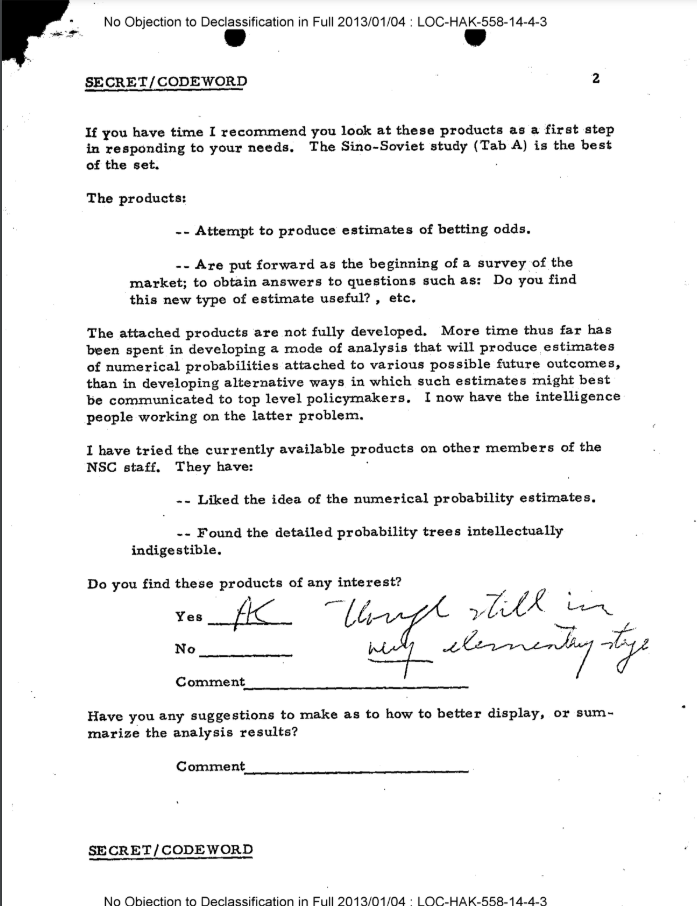
Here is the March 1973 memo “Experimental Intelligence Products to Improve the Communication of Uncertainty” (LOC-HAK-558-14-4-3) about Kissinger’s request for betting odds:
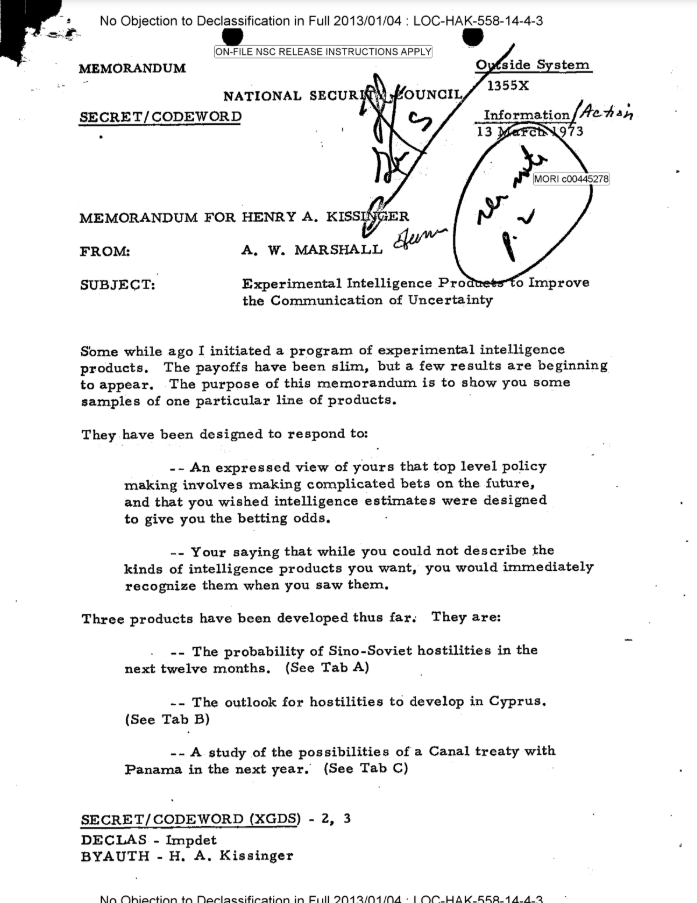
In this article, we’re going to look at those “betting odds” on war and international relations:
Tab A: The probability of Sino-Soviet hostilities in the next twelve months.[Withheld]- Tab B: The outlook for hostilities to develop in Cyprus.
- Tab C: A study of the possibilities of a Canal treaty with Panama in the next year.
And it should be acknowledged that the title of this article is misleading on two counts:
- This piece isn’t really about Henry Kissinger, but Andrew Marshall (the “A.W. Marshall” who wrote the memo.)
- The memo and addendums don’t actually contain “betting odds” but probabilities for conflicts occurring and the models for arriving at those probabilities.
Known as the Pentagon’s “Yoda,” Marshall was a legendary intelligence analyst, serving as Director of the Department of Defense’s Office of Net Assessment (ONA), a.k.a. the “Pentagon’s Think Tank”, for 42 years (1973-2015). That’s through Presidents Nixon, Ford, Carter, Reagan, Bush, Clinton, Bush, and Obama.
Despite never having completed his undergraduate degree, Marshall was admitted into the Economics graduate program at the University of Chicago in 1945. Rather than pursuing a Ph.D. after completing his Masters, Marshall went to work at the RAND Corporation, a think tank with close ties to the US Military, for over 20 years (1949-53, 1954-72). Kissinger recruited him to conduct a series of intelligence studies starting in the fall of 1969, hired him away from RAND to run net assessment at the National Security Council, and then internal Nixon administration politics shipped off both Marshall and net assessment to the Pentagon in late 1973.
The March 1973 memo was not the first instance of using “betting odds” or probabilities to quantify intelligence analysis. In the CIA’s “Studies in Intelligence” (Vol. 16 No. 2, Spring 1972) the year before, there were several articles on the subject of using a Bayesian approach to forecast international conflict. But Marshall seems to have been a driver for change. On February 15, 1973, Marshall lectured the CIA on improving intelligence “products” for its “consumers”:
Turning to new methods, [Marshall] held up Bayesian analysis as providing a systematic way of handling uncertainties citing Dr. Kissinger’s comment to him that policy-making is “betting on the future.” Mr. Marshall suggested, that we might try expressing our intelligence judgments to Dr. Kissinger in the form of betting odds.
While the version released of the March 1973 memo does not contain any of the experimental intelligence products, two of the three tabs can be found included within “Probabilities in Intelligence Analysis” (LOC-HAK-538-3-5-6) from November 1973, a memo Marshall wrote to Brent Scowcroft as he was about to leave the National Security Council for the ONA. The section on the likelihood of the Sino-Soviet war is still classified but the two others on Cyprus and Panama are publicly available.
An Appraisal of the Probability of an Outbreak of Hostilities on Cyprus
Marshall’s memo lays out some definitions and background on the situation in Cyprus and then presents different models of the situation: probability tree diagrams and Markov chains.
Probability Diagram
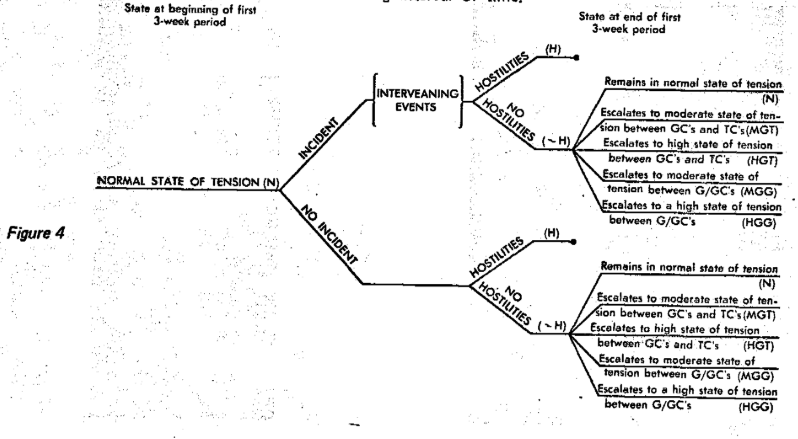
From the memo:
The probability diagram [above] identifies three types of incidents which might lead to hostilities. The first two branches describe the most important types: (I) those between Greek Cypriots (GC’s) and Turk Cypriots (TC’s), called intercommunal incidents, and (2) those between antagonistic factions of GC’s, called inter-Greek incidents. Based on an analysis of reported incidents over the past six months, it is about twice as likely that any given incident will be intercommunal rather than inter-Greek. Figures 6 and 7 which follow will develop the implications of the intercommunal and inter-Greek incidents respectively.
The third branch of Figure 5 describes all other kinds of incidents and is included to exhaust all possibilities. An incident between Soviet and Turkish vessels off the coast of Cyprus, during a Turkish troop rotation, is an example of this category. This type of incident is very unlikely to occur and very unlikely to lead to hostilities so, although it is included in this analysis, it will not be discussed further.
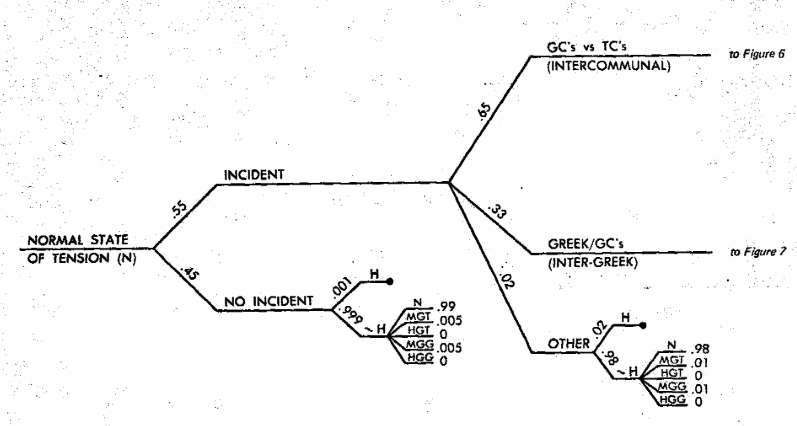
The complete probability diagram (Figure 8) can be found on pp. 48-49 of the declassified memo (LOC-HAK-538-3-5-6), but Marshall also includes a simplified version:
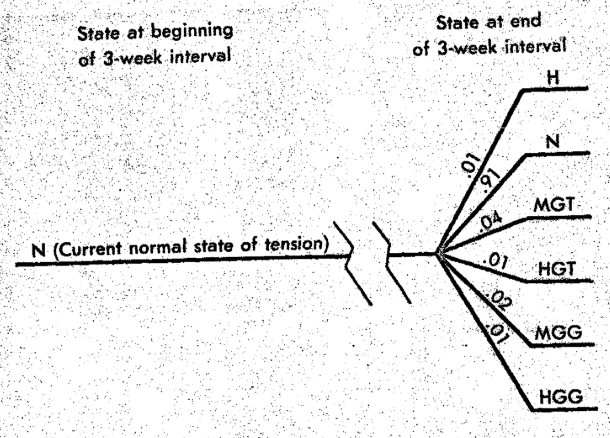
Because of this, the large probability diagram, which is useful for analysis of the many possible implications of an incident, can be summarized by the simple diagram [above]. It displays the expected probability of terminating in each of the six possible end states. There is a one percent chance of moving into hostilities during the three-week interval but Cyprus is far more likely to continue in a normal state of tension.
Markov model
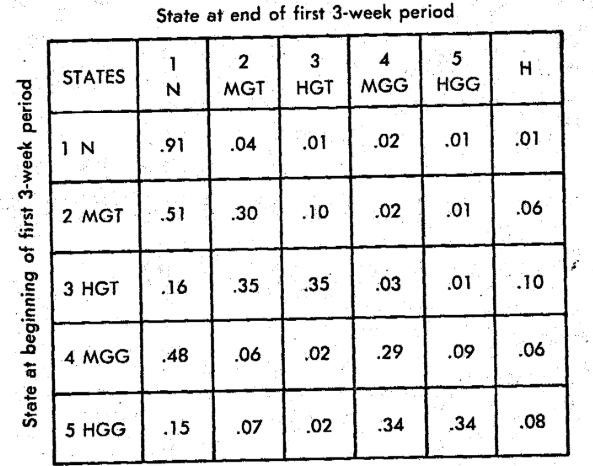
[The figure above] displays the transition probabilities — the probability of moving from one state to another in any three-week period – assessed for all possible states. For example, it shows that there is a 91 percent chance of remaining in the normal state at the end of any three-week period if Cyprus was in the normal state at the beginning of the period; a 4 percent chance of moving to a state of moderate Greek-Turk tension, and so forth. Implicit in this matrix is an important underlying assumption; namely, that the probability of moving from one state to another is dependent only on the state at the beginning of any period, not on how that beginning state was reached.
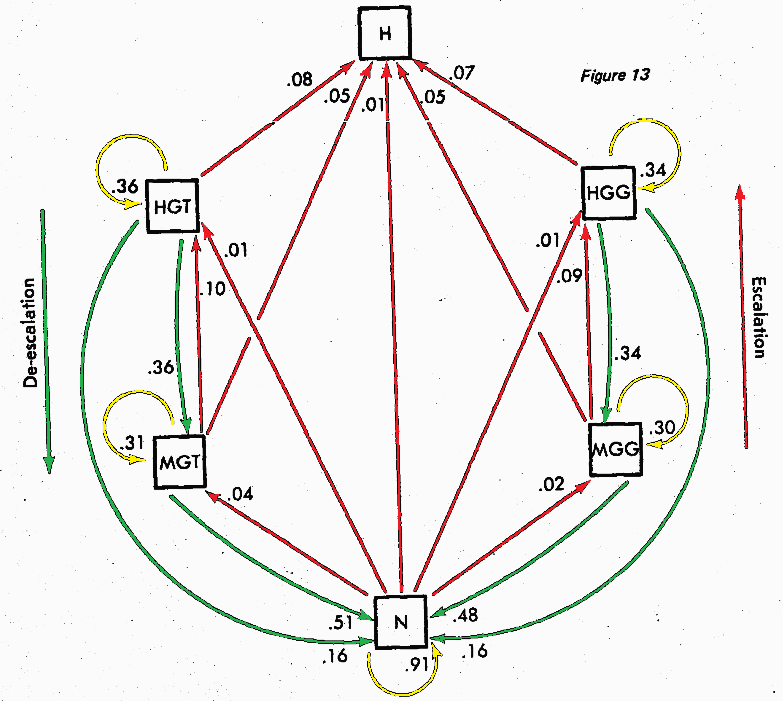
The process of escalation and de-escalation is fully incorporated only by extending the time horizon many periods. The abbreviated state diagram, Figure 13 [above], shows how this escalation and de-escalation can occur. Each arrow refers to a single three-week period. The probabilities attached to the connecting arrows come from the matrix in Figure 11. The red arrows show escalation toward hostility or increased tension, the green arrows show movement toward decreased tension, and the yellow arrows imply that the state doesn’t change. [Please note that the released document was entirely black and white; colors were added here for clarity.] Tension between the Greeks and Turks is shown on the left and that among Greeks on the right. The arrows which connect these left-and-right-hand states are not shown. Any possible sequence, such as escalation followed by de-escalation, can be represented by chaining together a sequence of three-week transitions.
…
The process described by Figure 13 is called a Markov chain. Because of the particular transition probabilities given in Figure 11, this Markov chain, which represents the forces at work on Cyprus, indicates that there is a high probability of Cyprus being in low states of tension in the future. First, it is more likely (9) percent) to remain in a normal state than it is to move into a higher state of tension. Second, if it enters a higher state it has only a 30-36 percent chance of remaining there and, if it leaves, the most likely transition is a de-escalation to a lower state of tension.
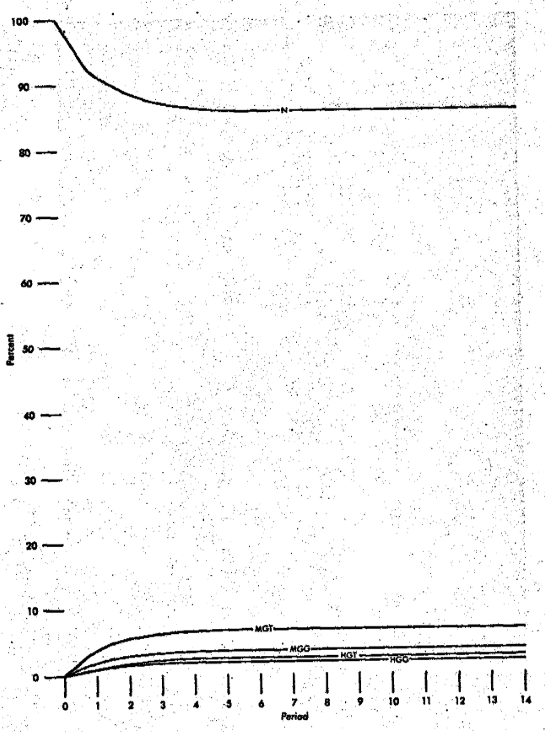
Figure 15 [above] shows, as a function of time, the probability that Cyprus will be in the normal state; assuming that the process begins in the normal state and has not yet reached hostilities. Beyond approximately four months, the figure shows that there is about an 85 percent chance that Cyprus will be in the normal state and only about a 15 percent chance that it will be in a higher state of tension.
Conclusion: The Probability of Hostilities
The goal of this analysis is to assess the probability that hostilities will begin on Cyprus. The red curve in Figure 16 [below] shows how that probability increases with time. This curve is derived from the matrix in Figure Il. It shows that there is about a 14 percent chance that hostilities will begin within a six-month period and-that it is about as likely as not (48 percent) that hostilities will occur within two years. These assessed probabilities are based on starting in the current, normal, state of tension. If, on the other hand, Cyprus were now in a high state of tension, there would be a much greater chance of hostilities beginning. For example, if there were now a high state of tension between GC’s and TC’s the probability of hostilities would be given by the dashed curve in Figure 16. In that case, there would be about a 30 percent chance of hostilities within six months and 50 percent within a year and a half.
The Analysis
The use of structured analysis procedures improved on a completely intuitive analysis in two major ways. First, it encouraged the analyst to think through his problem in a clear and logical manner. Factors affecting the likelihood of hostilities were explicitly identified and uncertainties surrounding the occurrence of future events were formally incorporated into the analysis. Second, the use of probability diagrams and the Markov model provided a means for the analyst to play his intuitive assessments with respect to hostilities against the implications of the model to insure logical consistency. For example, the analyst a) made a direct assessment of the probability of hostilities, then b) assessed the probability of hostilities indirectly through the probability diagram, c) assessed the percentage of time in a tension state, and d) judged a time in the future such that he would be indifferent as to whether hostilities would occur before or after that time.
As it happened, these separate assessments were incompatible with each other given the underlying structure of the model which the analyst felt was correct. Consequently, it was necessary to adjust the different assessments, constrained both by the logic of the model and by the analyst’s knowledge of Cyprus. It is not the case that the analyst assessed the probability of hostilities and then constructed a model that was compatible with that assessment. On the contrary, given the feedback from the model, he adjusts all of his assessments until convergence was achieved between the implications of the model and his perception of the situation.
Communication
In addition to sharpening the analyst’s perception of the structure of his problem, these analytic procedures also enhance the communication of the likelihood of hostilities and the reason for that likelihood. In the first place, the use of a percentage, 14 percent, to describe the likelihood of hostilities is certainly more meaningful than the use of a verbal qualifier such as “unlikely”. In addition, the use of the probability diagram and Markov model communicates a quantitative justification for the probability assessment so that if the reader does not agree with that assessment, he not only knows that he disagrees, but where and by how much. The use of the analytic model thus serves to focus dialogue and debate in specific areas instead of on the assessment as a whole.
On July 15, 1974, roughly 18 months after Marshall first shared these ‘intelligence products’ with Kissinger, the Cyprus National Guard removed the President of Cyprus from office in a coup d’état. Five days later, Turkey invaded Cyprus, starting a war that lasted less than one month, but leaves Cyprus divided 50 years later.
The Panamanian reactions in the Panama Canal negotiations.
The United States had exclusive control of the Panama Canal Zone since 1903 but wanted to renegotiate the treaty with Panama to build a new sea-level canal. Panama wanted concessions regarding money and sovereignty of the canal zone. President Lyndon Johnson and then-President Robles agreed to three draft treaties in 1967, only for Robles to lose re-election in May 1968, and his predecessor to be overthrown by a military coup in 1968. The draft treaties were never enacted.
The former head of the National Guard, and new dictator, Omar Torrijos was uncommitted to pursuing a deal on the canal with the United States. Torrijos rejected the draft treaties out of hand, leading to a new round of negotiations in 1971. These negotiations were not going well, and the National Security Council was trying to ascertain the probability of reaching an agreement with Panama on the canal in 1973.
The quantitative analysis quoted below was a “side product” of the CIA’s Intelligence Memorandum on the US-Panama negotiations:
In an attempt to sharpen the analyst’s perception of the structure of the problem, quantitative justification is substituted for the probability assessments that are usually expressed by verbal qualifiers such as “likely” and “unlikely.” Key factors affecting the prospects for reaching an agreement on a new canal treaty in 1973 are explicitly identified and displayed by the use of a probability diagram. It is important that this format not imply a false precision. No attempt is made to do more than present analytical judgments in quantitative form. The reader by following along can decide whether he agrees or disagrees with the probability assessment. If he disagrees he can more easily than in a textual presentation identify those assumptions he disputes and pinpoint where and by how much he would alter the assessment, thereby focusing more sharply on the problem.
Three options (or “Postures”) are presented:
- “Under the first option, the US adopts an aggressive approach through 1973 undeterred by Panamanian “toughness.” The US takes the initiative in presenting proposals and then refines these proposals in light of Panamanian criticism. In addition, it is assumed that the US adopts a position that comes closer to meeting Panamanian aspirations on duration and jurisdiction.”
- “The second option assumes that the US demonstrates a very positive attitude toward canal negotiations and is prepared to offer at various points certain concessions outside of the negotiating framework that are designed to win Panamanian good will and demonstrate the good faith of the US. These concessions might include joint police patrols in the Zone, flying the Panamanian flag on vessels transiting the canal, or transferring certain facilities within the Zone to Panama. The US under this option does not take an activist position on the negotiations, and makes no substantial change in its stand on duration and jurisdiction.”
- “The third option assumes that the US is ready to negotiate, but that after it makes a comprehensive offer to Panama, the ball is in the Panamanian court. Under this approach the US stands back and leaves the initiative to Panama. The US eschews any significant concessions outside the negotiating framework and does not substantially modify current positions on duration and jurisdiction.”
Under each of these policy options, an assessment is made of various probabilities below. (Note: The original passage has been rearranged for brevity and clarity while preserving the original words and intent.)
- [Omar] Torrijos will remain in power through the end of 1973.
- A decision being made in January [1973] to hold a Security Council meeting in Panama.
- Net Effect of Events before the meeting:
- events occurring prior to March will give Panama a positive attitude toward the US. Such events might include a high-level bilateral meeting, some advance in the negotiations, or some interim concessions.
- events occurring prior to March which might sour Panama’s attitude toward the US…such as coup plotting linked to activities in the Canal Zone or unfavorable publicity on narcotics.
- (a) positive or negative events that might cancel each other out, (b) the possibility that no significant events occur, and (c) that Panama’s attitude toward the US is neither particularly positive nor negative.
- Panama’s probable behavior at the meeting — whether it will adopt a vitriolic anti-US tone or a non-aggressive tack.
- Torrijos becoming personally involved in the negotiating process.
- In light of all of the previous factors, the probability of signing a treaty in 1973.
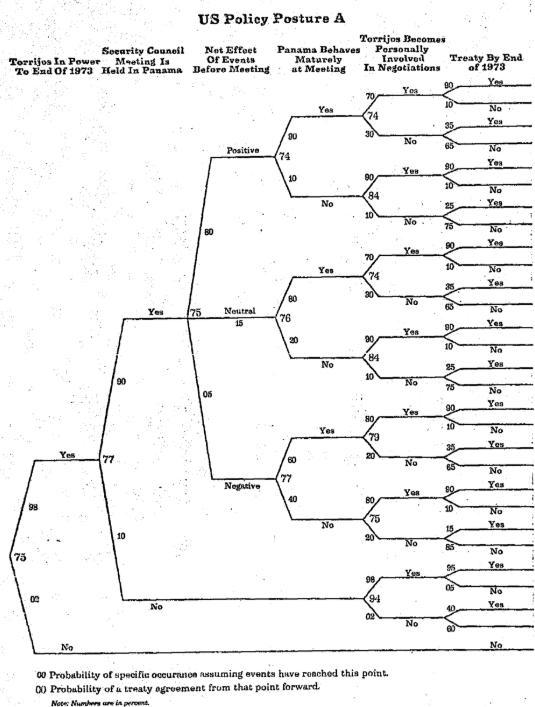
Here are how the six factors played out in the probability diagram for the first option (“Posture A”):
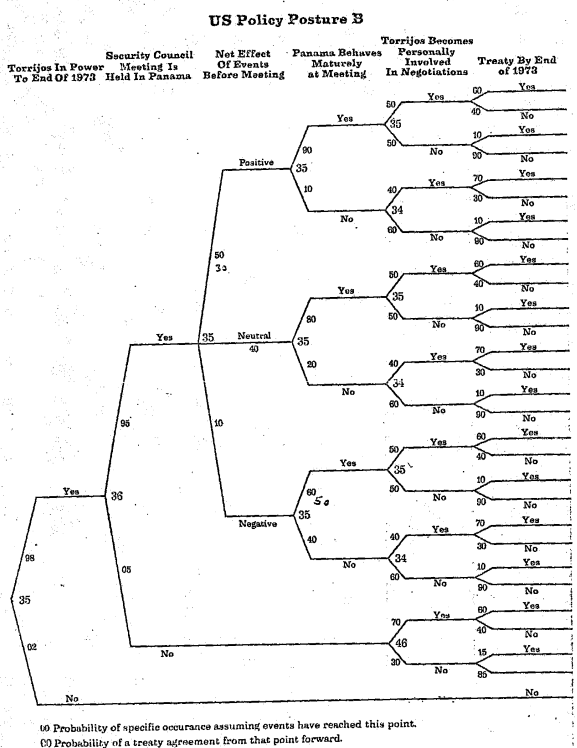
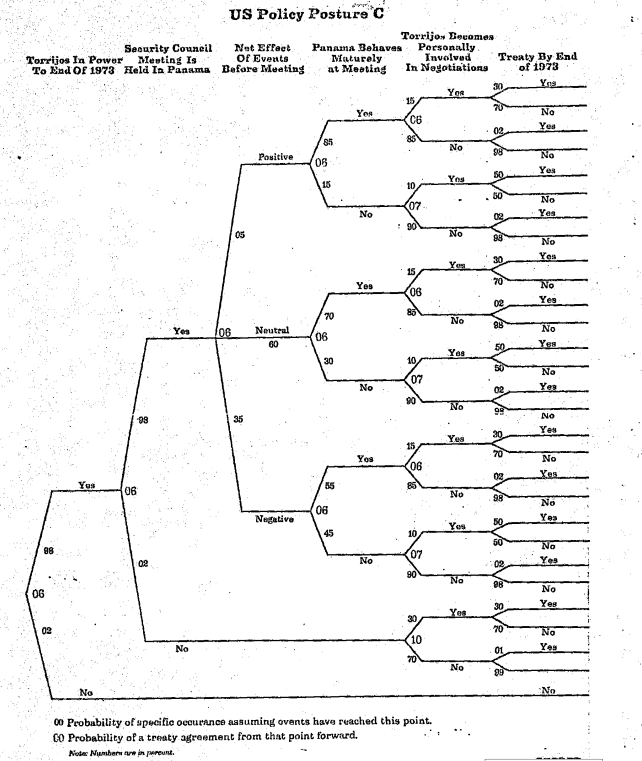
The probability diagrams for Postures B and C can be found in document LOC-HAK-538-3-5-6, but here are how the chances of a treaty in 1973 played out in the three different models:
- Posture A: 75%
- Posture B: 35%
- Posture C: 6%
The Panama Canal intelligence analysis is dated November 28, 1972. According to “Putting the Canal on the Map” by Professor Tom Long, negotiations fell apart shortly thereafter:
Meanwhile, the December round of negotiations approached a complete collapse. There was little common ground between the positions advanced by each side; the talks were further complicated by internal struggles within both the U.S. and Panamanian governments that undermined support for the negotiators. Frustrated at the bargaining table, and seeing further talks with Anderson as futile, Panama was willing to take greater risks by openly challenging the United States internationally.
The UN did hold a Security Council Meeting in Panama City in March 1973, but Panama did not behave “maturely” and the US vetoed a UN resolution put forward by the host country. No treaty was signed in 1973, but in the following year, the US and Panama concluded an “agreement on the principles” that saw the US concede both sovereignty and “a fixed termination date” for handing over the canal.
Eventually, two treaties were signed in 1977:
- The Treaty Concerning the Permanent Neutrality and Operation of the Panama Canal, giving the US the right to defend the ‘neutrality’ of the canal.
- The Panama Canal Treaty, giving Panama control in 1999.
Torrijos died in a mysterious plane crash in 1981 and Manuel Noriega consolidated power to become the next dictator.
Marshall in retrospect
Between his 23 years at RAND and 42 years at ONA, Andrew Marshall left a lasting legacy on strategic thinking in both the United States and around the world.
While he is widely respected (and revered in certain circles) today, it’s important to remember that not everyone appreciated Marshall back when he was working to quantify intelligence products:
For further information about Andrew Marshall, please check out:
- The Andrew W. Marshall Foundation
- The Last Warrior: Andrew Marshall and the Shaping of Modern American Defense Strategy
- Reflections on Net Assessment
- Military Operations Research Society (MORS) Oral History Project Interview of Andrew W. Marshall
- “Program for National Net Assessment” memorandum (1973)
- “Cautious Reactions Greet Plan for Cuts at Pentagon” (1997)
- “The Return of the Pentagon’s Yoda” (2018)
- Casting Net Assessment: Andrew W. Marshall and the Epistemic Community of the Cold War
- RAND publications by Andrew Marshall
- VIDEO: Presentation of the George P. Shultz Award for Distinguished Service