FiveThirtyEight’s model is actually three different official model versions built on top of each other with polling, fundamentals, and expert forecasts:
| Version | Component(s) |
| Lite | Polling |
| Classic | Polling, Fundamentals |
| Deluxe | Polling, Fundamentals, Expert forecasts |
Polling: Polls are weighted based on their sample size, recency, and pollster rating. (Pollsters are rated by methodology and past accuracy.) In 2022, FiveThirtyEight reduced the emphasis on sample size when weighting polls. (Lite, Classic, & Deluxe versions)
Fundamentals: Includes variables such as fundraising, incumbency, candidate experience, congressional voting records and even scandals. In 2022, fundamentals component was tweaked to put more emphasis on partisanship and the generic ballot. (Classic & Deluxe versions)
Expert forecasts: Incorporates race ratings from the Cook Political Report, Nathan Gonzales’s Inside Elections, and Professor Larry Sabato’s Crystal Ball. (Deluxe version)
Below we’re comparing state-level forecast for each model version over time in the 2020 and 2022 U.S. Senate elections. Specifically, we’re using Brier scores to measure forecasting error. All model outputs are being compared over time because a forecast from Election Day is about as useful as forecasting the winner of a football game at the end of the fourth quarter.
As always, there are a few caveats:
- Different states held senate races in 2020 and 2022.
- One election was a presidential year and the other a mid-term.
- FiveThirtyEight’s model was adjusted between elections.
- Pollsters tweak their methodology from election to election as well.
- Outputs end on Election Day in both years even though Georgia had run-offs both years.
- Because political events (and scandals) are constantly changing, polling or model outputs at a point in time could turn out incorrectly through no fault of the model.
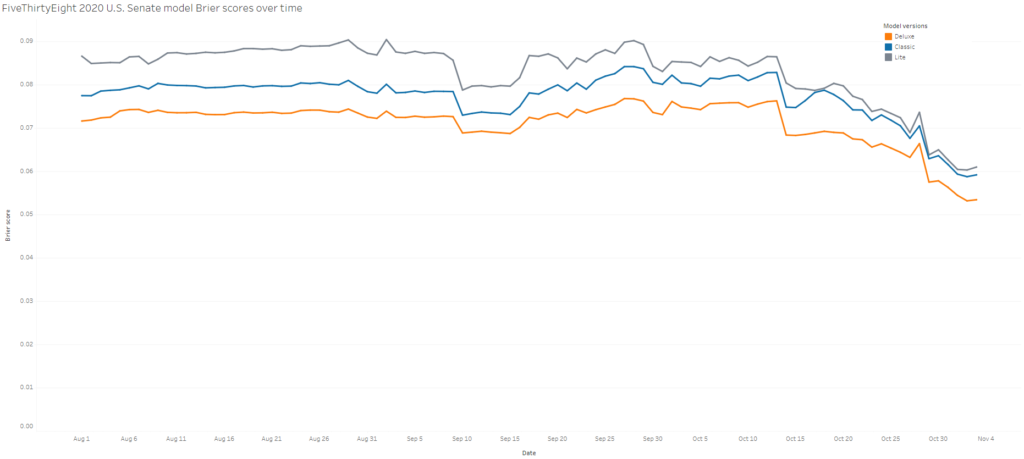
In 2020, the three models had nearly identical fluctuations over time, all decreasing in error the final month leading up to Election Day:
In 2022, the models’ Brier scores were less stable over time, but all increased in Brier score the final month before Election Day:
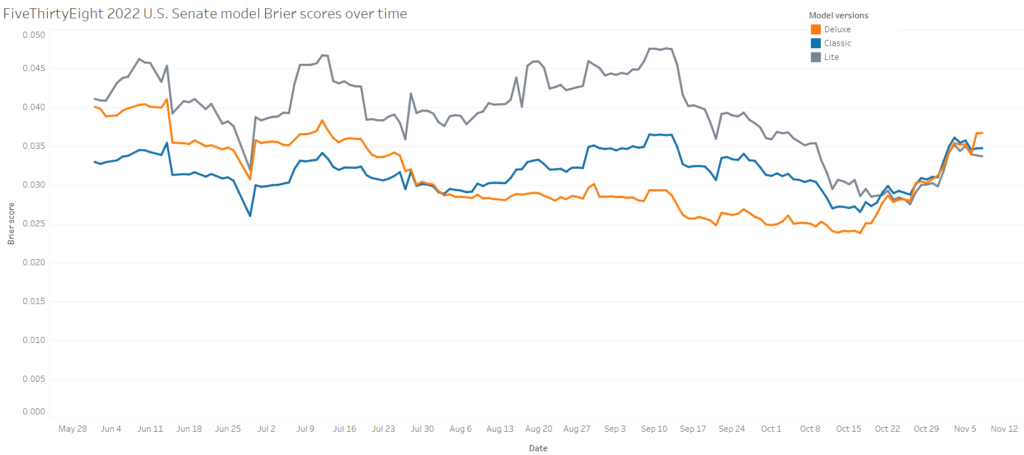
Looking at the Democratic candidate’s probabilities in the Deluxe model for the final three days of the 2022 General Election, that uptick at the end was driven by the model moving in the wrong direction for both Georgia and Pennsylvania. Below are Deluxe model outputs for the Democratic candidate:
| Election | Nov 6 | Nov 7 | Nov 8 |
| Georgia | 0.42608 | 0.36813 | 0.36770 |
| Pennsylvania | 0.54325 | 0.42808 | 0.42660 |
Note that an error in the Deluxe version from mid-September through Election Day caused the ratings incorporated from Inside Elections to stop updating. Using the corrected outputs for the Deluxe model version on Election Day, we see the Brier score decreased, but was still higher than the Lite (polls only) model:
| Version | Brier score |
| Deluxe (incorrect) | 0.03668 |
| Classic | 0.03472 |
| Deluxe (corrected) | 0.03376 |
| Lite | 0.03367 |
Data comes from the FiveThirtyEight model outputs for 2020 and 2022. The probabilities used are “winner_Dparty” and “winner_Rparty” which represent the “chance that the corresponding party, regardless of candidate, wins the seat.”