A previous article looked at how correlated certain 2024 Presidential candidate nomination contracts on PredictIt are with their respective parties winning the General Election. We saw a positive correlation through March 1st between PredictIt share prices for former President Donald Trump winning the 2024 Republican nomination and the Republican Party’s candidate winning the 2024 U.S. Presidential General Election. From March 2nd onward, those two contracts had a strong negative correlation.
To further examine how the relationship between the chances of Trump’s nomination and Republicans winning the General Election, we’re using a 30-day rolling correlation to measure the changing linear relationship between the chances of Trump’s nomination and Republicans winning the General Election.
Pearson’s correlation coefficient is used to measure the linear correlation between the two contract prices. It is NOT measuring whether both prices increase, but whether both prices move together. If Trump and GOP prices both increase (or both decrease) that is a positive correlation. If say Trump prices increase while GOP prices decrease, that is a negative correlation. The Pearson coefficient ranges from -1 (perfect negative correlation) to +1 (perfectly positive correlation). To visualize how their relationship changed over time, we’re using a rolling correlation with a 30-day window of PredictIt’s closing (Yes) share prices from May 22, 2022, to May 29, 2023.
PredictIt is a prediction market where traders can buy “Yes” and “No” shares on who will win (or lose) a specific election (i.e., “Who will win the 2024 Republican presidential nomination?”, and “Which party will win the 2024 U.S. presidential election?”) A correct prediction pays out $1/share and a wrong prediction receives nothing. The values of shares change over time as traders buy and sell them. Share prices can represent what traders believe to be the probability of that candidate or party winning an election.
The dual-axis chart below shows the rolling correlation in gray (left axis) and Trump and GOP share prices in orange and red, respectively (right axis). Click on the image to use the interactive graph:

The relationship appears to be both less stable than assumed in the prior article and driven by the news cycle: the January 6th Committee Hearings, the many Trump legal events of the past year, Trump’s official campaign announcement, and the May 11th Trump CNN Town Hall.
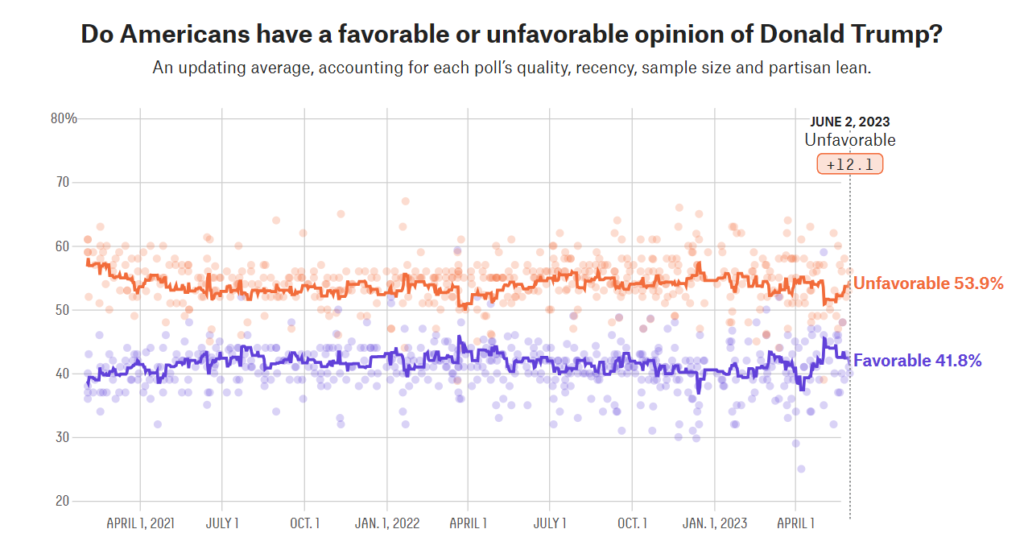
And while Trump’s prices (and probability of winning) have fluctuated along with the Republican Party’s, Trump’s Favorable/Unfavorable polling has remained consistent:
Further analysis could dive deeper into the specific events that changed the relationship between Trump nomination share prices and Republican General Election share prices. Because of the 30-day window, multiple events could have influenced any given correlation coefficient. For example, in April, Trump was both indicted and the E. Jean Carroll’s rape lawsuit went to trial.