PredictIt is a political prediction market run by Victoria University of Wellington, New Zealand, and Aristotle International of Washington, DC. PredictIt traders can buy “Yes” and “No” shares on whether each candidate or party will win a specific election (i.e., “Who will win the 2024 Democratic presidential nomination?”, “Who will win the 2024 Republican presidential nomination?”, and “Which party will win the 2024 U.S. presidential election?”) A correct prediction receives $1/share and a wrong prediction receives $0/share. The contract share prices can represent what traders believe to be the probability of that candidate or party winning the election.
PredictIt traders are betting on Trump to win the GOP Presidential nomination in 2024, but no longer see the Republican Party as the favorite to win the General Election. This raises the question of how correlated are shares in the 20204 US Presidential party nomination markets (Republican and Democratic) with shares for which party will win the 2024 U.S. Presidential election.
The specific candidates we’re looking at winning their party’s nomination:
- President Joe Biden (Market: 7057, Contract: 24807)
- Vice-President Kamala Harris, as the Presidential nominee (Market: 7057, Contract: 24808)
- Former President Donald Trump (Market: 7053, Contract: 24787)
- Governor Ron DeSantis (Market: 7053, Contract: 24814)
The above candidates are all members of these two parties:
- Democratic (Market: 6867, Contract: 23547)
- Republican (Market: 6867, Contract: 23546)
To measure the linear correlation between each candidate’s nomination share price and their respective party’s General Election share price, we’re using the Pearson correlation coefficient, which ranges from -1 to 1. A positive value means that a candidate’s nomination share price increases as their party’s General Election share price increases. A negative value means a candidate’s nomination share price and their party’s General Election share price are inversely correlated: as one increases the other decreases.
The specific price we’re measuring for each candidate and party is the “closeSharePrice” on PredictIt from April 23, 2022, to May 8, 2023 (381 days.)
As shown in the table below, President Biden is the only candidate with a positive linear correlation, with the other three having a negative correlation with their party’s chances of winning.
| Candidate | Party | Correlation |
| Biden | Democratic | 0.967277 |
| Harris | Democratic | -0.802076 |
| Trump | Republican | -0.341302 |
| DeSantis | Republican | -0.110157 |
By plotting both sets of share prices, we can clearly see the very different linear relationships between the Democratic Party’s chances and both Biden and Harris. Click on the chart below to see the interactive Tableau dashboard.
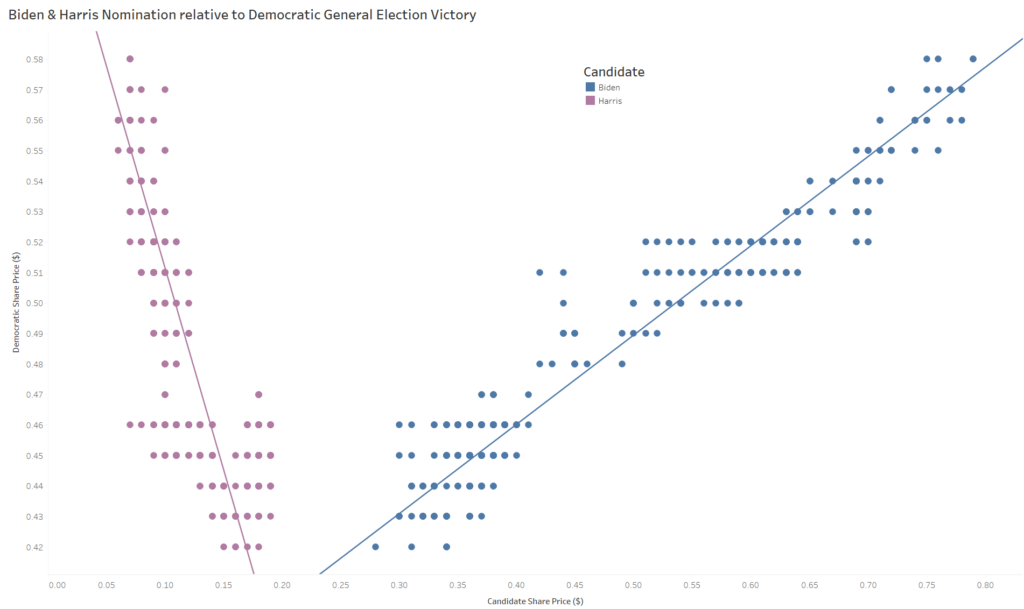
Harris’ strong negative correlation isn’t too surprising; she isn’t even a candidate for her party’s presidential nomination. On the other hand, Biden’s very high (almost 1) positive correlation means that as his share prices increase, the Democratic General Election shares increase (and vice versa).
The Republican picture isn’t as clear, as evidenced by the chart below:
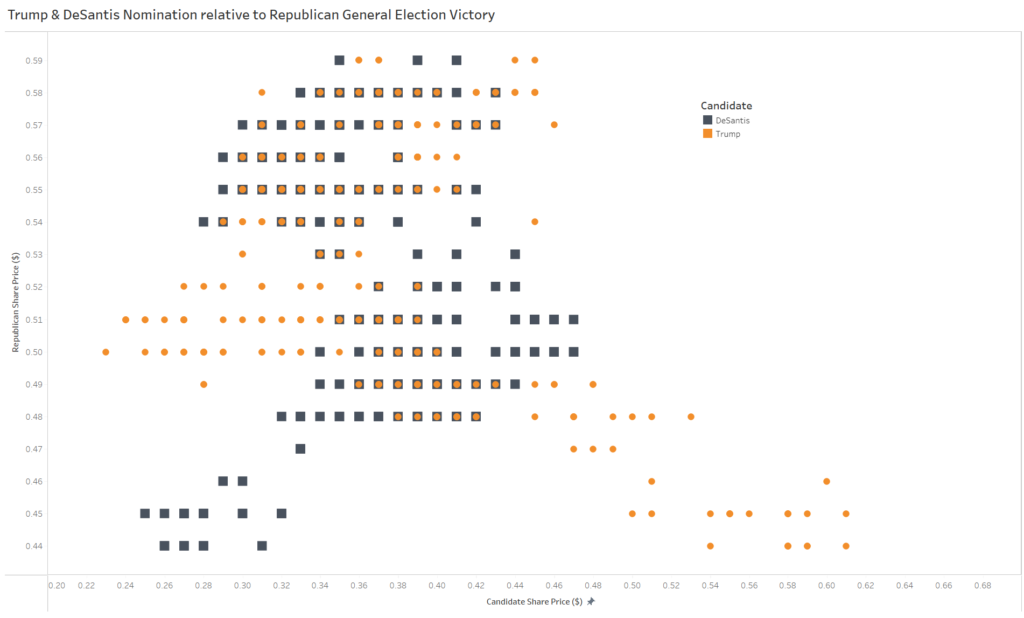
Both Republican candidates have a much weaker correlation than the Democrats between their candidate’s winning the nomination and their party’s chances in the General Election.
Trump’s ongoing legal issues simultaneously with his rise in the polls, could be causing the disconnect between the GOP nomination and the General Election markets. From April 23, 2022, through March 1, 2023 (313 days), the Trump nomination share prices had moderate correlation (r = 0.515291647) with the Republican General Election share prices. While Trump’s legal issues have been ongoing, arguably before he ran for President, the avalanche began with Trump announcing he was going to be arrested on March 18, his indictment on April 4, and E. Jean Carroll’s rape lawsuit opening on April 25. (The data used ends on May 8, and does not include the jury finding Trump liable for sexual abuse on May 9 or the CNN town hall on May 11.)
These recent legal issues seem to have influenced trader’s views on Trump’s chances for winning the nomination relative to the Republican candidate being elected U.S. President in 2024. From March 2, 2023, to May 8, 2023 (68 days), Trump nomination and Republican General Election share prices have a strong negative correlation (r = -0.88556.)
As always, there are a few caveats:
- Please remember that correlation is not causation. Because both Biden and Democratic shares increase (and decrease) together doesn’t mean one is directly causing the other share price to move.
- Several of PredictIt’s rules limit liquidity. There are caps for both the amount invested ($850/market) and the number of investors per market (5,000). Participation in PredictIt is limited to individuals 18 years of age or older who are U.S. Persons.
- The Commodity Futures Trading Commission is currently attempting to shut down PredictIt, so share prices may not accurately reflect what traders believe the likelihood of the event to occur, but how the contracts will be resolved if the platform is shut down before the elections take place.