As discussed in an earlier post, as of the morning of Election Day 2020, The Economist’s presidential forecasting model had a slightly higher Brier score (lower = better, higher = worse) than FiveThirtyEight’s model, but each model correctly predicted the outcome in the same number of states (49 out of 51). This made me curious about how the accuracy of each model changed over time.
I’m starting by comparing Brier scores of The Economist’s model output over time. While I initially assumed the model outputs would be more accurate closer to Election Day, the opposite appears to be true. In the chart below you can see Brier scores for the Economist model from August 16th to November 3rd in blue with a trend line in red:
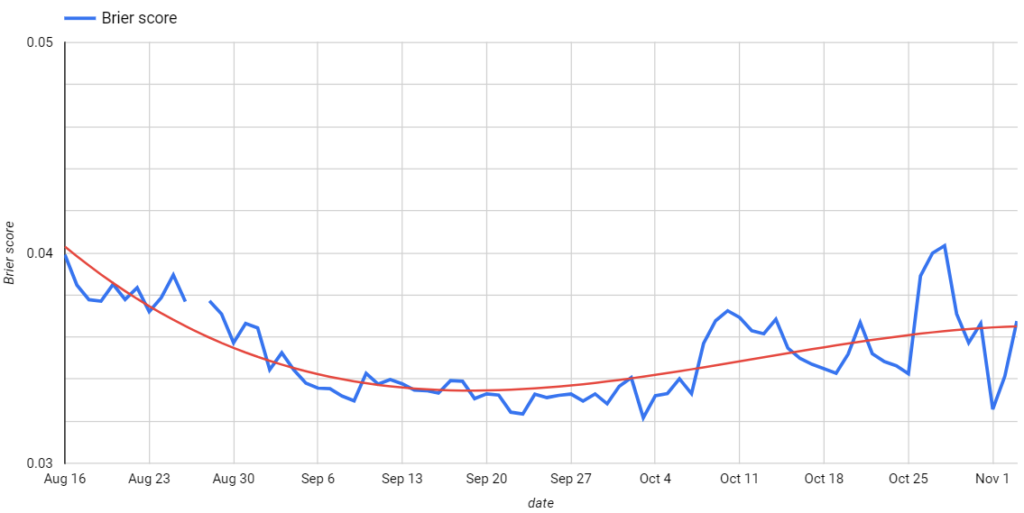
The lowest Brier score was on October 3rd (0.03216) and the highest on October 28th (0.04034), with the trendline rising from mid-September through Election Day. The difference in the Brier scores between those two dates is driven by three states where the model increased Biden’s probabilities of winning three states he eventually lost. Below are model outputs from the best (October 3rd) and worst (October 28th) days:
| Candidate | State | 10/3/2020 | 10/28/2020 |
| Biden | Florida | 0.68515 | 0.792575 |
| Biden | Iowa | 0.3246 | 0.563725 |
| Biden | North Carolina | 0.5734 | 0.7294 |
If we exclude those three states from the Brier scores, the October 28th model (0.01207) had a lower (again, meaning better) score than October 3rd (0.01535). And the model would adjust Biden’s probabilities in Iowa by Election Day, so the final predictions were correct about Biden losing Iowa.
A couple of things to keep in mind:
- All The Economist’s model Brier scores were both low and relatively close together.
- This analysis only uses one scoring function.
- I downloaded The Economist’s model outputs only once per day and the outputs could have been updated after I saved them. While I previously referred to model outputs by the day they were accessed, this post refers to models by the date they were run. And please note there is missing data from August 27th.
- Public opinion solidifies closer to Election Day, and there were several significant political events throughout the Fall of 2020, so it’s possible the models (and polls) were accurately reflecting public opinion at that moment in time. Coincidentally, the best-performing model outputs (Oct 3) came out the same weekend Trump tested positive for COVID (Oct 2) and had his hospital drive-by (Oct 4).
For future analysis, I’m curious about how FiveThirtyEight’s model performed over time, particularly compared to The Economist.