This was a big week for Kalshi, with Monday’s CFTC hearing and the exchange’s second anniversary.
Like other prediction markets, Kalshi traders buy and sell binary option contracts: an event either happens or does not happen (Yes or No). A correct prediction receives $1/share, and a wrong prediction receives $0/share. The share prices can indicate what traders believe is the probability of the event happening.
Unlike other prediction markets (such as PredictIt, Polymarket, or Insight Prediction) Kalshi is a federally regulated exchange for event contracts.
One year ago, we looked at the top markets in Kalshi for their first anniversary. Below we’re looking at the most active markets – a trading volume greater than 500,000 – over Kalshi’s first two years:
| Event | Summary | Volume |
| INXY-23DEC29-B5200 | S&P500 yearly close | 2,073,931 |
| INXY-23DEC29-B3600 | S&P500 yearly close | 1,300,421 |
| INXY-23DEC29-B3400 | S&P500 yearly close | 1,197,187 |
| NASDAQ100Y-23DEC29-B12750 | Nasdaq-100 yearly close | 1,163,918 |
| INXY-23DEC29-B3200 | S&P500 yearly close | 1,073,651 |
| INXY-23DEC29-B3000 | S&P500 yearly close | 1,036,358 |
| FED-23MAY-T5.00 | Fed Interest Rates | 834,466 |
| NASDAQ100Y-23DEC29-B12250 | Nasdaq-100 yearly close | 807,612 |
| NASDAQ100Y-23DEC29-B11250 | Nasdaq-100 yearly close | 801,838 |
| INXY-23DEC29-B3800 | S&P500 yearly close | 774,135 |
| FED-23JUN-T5.25 | Fed Interest Rates | 753,648 |
| INXY-23DEC29-T5299.99 | S&P500 yearly close | 698,574 |
| FED-23MAR-T4.75 | Fed Interest Rates | 676,077 |
| NASDAQ100Y-23DEC29-B11750 | Nasdaq-100 yearly close | 610,825 |
| FED-23MAR-T5.00 | Fed Interest Rates | 602,997 |
| RECSS-22JUL | Recession by 2022 Q2 | 597,086 |
| FED-22SEP-T3.00 | Fed Interest Rates | 512,904 |
Overall Kalshi trade volume grew three-fold year-over-year:
| Year One (21-22) | 38,749,075 |
| Year Two (22-23) | 119,700,082 |
| Total | 158,449,157 |
The tables above use historical market data. Kalshi naming conventions have changed a couple of times in its existence, so the events are different than what we used one year ago. And each pair of YES and NO positions count as a single contract.
In the chart below we can see how trading on Kalshi has increased over time.
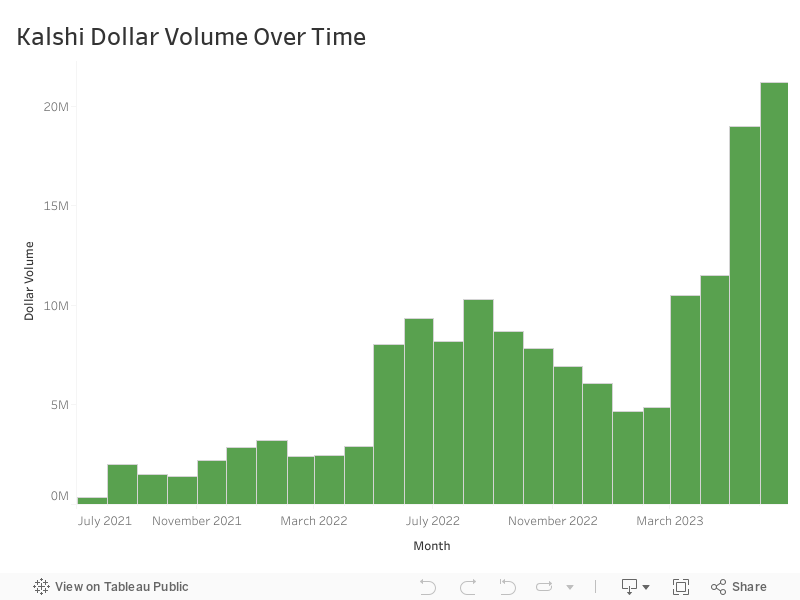
The increase from February to March 2023 was primarily driven by month-over-month increases in two markets: the daily market close for the Nasdaq-100 and S&P 500. We can see in the table below that those two daily markets account for roughly one-third of all Kalshi volume.
| Market | Volume |
| NASDAQ100D | 29,731,254 |
| INXD | 25,283,917 |
| Total | 158,449,157 |