Below we’re exploring volatility in PredictIt’s 18 markets for the 2022 U.S. Senate races, using standard deviation to measure share price volatility for the respective state’s Democratic candidate’s “Yes” contracts from April 23, 2022, through November 7, 2022 (199 days in total).
Standard deviation is a measure of how dispersed the market prices are in relation to the average price. A low standard deviation means prices are clustered around the average price, and a high standard deviation indicates prices are more spread out. Below are the 18 Democratic contracts sorted by most to least price volatility:
| State | Standard Deviation | Mean Share Price | Trade Volume |
| AZ | 0.11273 | 0.53643 | 976,984 |
| NH | 0.10335 | 0.67583 | 526,504 |
| PA | 0.10212 | 0.57894 | 1,675,856 |
| WI | 0.08378 | 0.31508 | 399,111 |
| GA | 0.07463 | 0.51940 | 944,355 |
| NV | 0.06928 | 0.43337 | 602,994 |
| NC | 0.06277 | 0.21307 | 282,036 |
| OH | 0.05008 | 0.20246 | 692,002 |
| FL | 0.03254 | 0.10025 | 314,174 |
| MO | 0.02909 | 0.07126 | 148,402 |
| WA | 0.02572 | 0.91322 | 485,870 |
| CO | 0.02380 | 0.85749 | 339,656 |
| IA | 0.01300 | 0.06869 | 170,830 |
| OR | 0.00998 | 0.95683 | 79,132 |
| VT | 0.00995 | 0.96075 | 172,132 |
| IL | 0.00800 | 0.95762 | 70,290 |
| AK | 0.00732 | 0.02156 | 41,779 |
| UT | 0.00000 | 0.01000 | 1,101 |
Unsurprisingly, the more competitive Senate races in 2022 experienced more price volatility.
Previously, we looked at the relationship between volume and share price in the 2022 Senate races. Below we’re looking at volatility (standard deviation) versus both volume and mean share price:
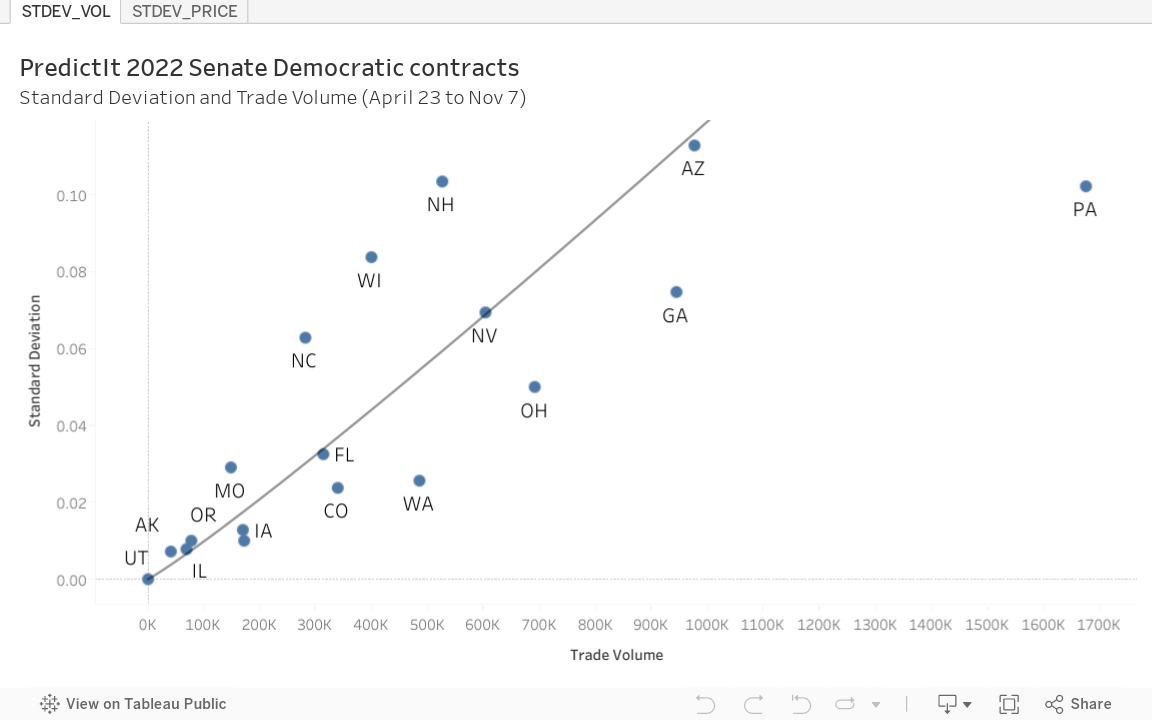
Volatility increased with volume, with the Pennsylvania Senate race being an outlier (possibly due to the tightness of that contest.) Volatility and price formed a bell curve, very similar to the price-volume curve mentioned above.
The data used can be found here.
As always, there are a few caveats:
- For various reasons, not all markets were decided on Election Day, so there were available closing prices not used to calculate volatility.
- Alaska is 4-5 hours behind the east coast with multiple time zone. The closing price on November 8th was not used.
- Arizona was closely contested with a high percentage of early and absentee ballots to be counted. The closing prices from November 8, 9, and 10 were not used.
- Georgia went to a run-off, so the 28 days from November 8th to December 5th were not used.
- Nevada wasn’t called on Election Day, and so the seven days from November 8th to 14th were not used.
- Wisconsin was closely contested and November 8th was not used.
- Additionally, data for the Illinois Senate race was not captured until May 3rd, so only 189 days were used.
- Utah is not a typo. Democratic “Yes” share prices closed at $0.01/share every single day captured so the standard deviation is zero. This was apparently such a hot contract that PredictIt even misspelled it as “Democractic”.
- Standard Deviation is only one way to measure the volatility of markets and closing share prices doesn’t account for price fluctuations during the day. Further analysis could attempt to calculate the beta coefficient for a contract.
- The CFTC pulling PredictIt’s no-action letter in August obviously could have influenced trader behavior.