There have been many other real-money prediction markets and election betting exchanges operating since The Iowa Electronic Markets (IEM) first opened on June 1, 1988. Some of these include Intrade, HedgeStreet (now known as Nadex), UBC Election Stock Market, The Penn State Prediction Markets, Politieke AandelenMarkt in Holland, and Wahl$treet in Germany. Not to mention play-money markets like The Washington Stock Exchange, Foresight Exchange, HiveInsight, NewsFutures, PopSci Predictions Exchange, Inkling Markets, and many others.
Patrick Delaney has written a short history of how prediction markets have changed with technology that is worth reading. Nuño Sempere has also created a comprehensive database of prediction markets; IEM is by far the oldest still operating and only one of two launched in the prior millennium. (The other is the Hollywood Stock Exchange.)
IEM’s structure, university oversight, and no-action letter, limited market topics (No dancing with Caitlin Jenner contracts) but created an incentive to collaborate with other universities and organizations. In certain respects, IEM was more ambitious than PredictIt or even Manifold Markets in how it partnered with entities both in and outside of America to engage traders. Most data from 1988 through 1998 is inaccessible so this article is going explore IEM markets from 1998 through today, focusing on some of their collaborative markets and aggregate data.
Iowa Political Stock Market
Widely considered the first prediction market, IEM was founded by University of Iowa professors in 1988 as the “Iowa Political Stock Market” (IPSM) created for the upcoming Presidential Election. In “Anatomy of an Experimental Political Stock Market” (1992), the authors write that only 192 traders participated in the prediction market because it was closed to the University of Iowa community. University lawyers had reservations about violating gambling and securities laws, and with months until the November election, there wasn’t enough time to expect the University to receive the needed exemptions. Eventually, a loophole was found in the state code allowing “betting pools within employee groups.”
The original market functioned differently from what many traders are used to today:
Aspiring traders were sold portfolios of shares in candidates at $2.50 each, with each basic portfolio consisting of one share in each major candidate in the campaign. The slate of candidates included George Bush, Michael Dukakis, Jesse Jackson, and a candidate labeled “Rest-of-Field.” Shares were given value by the dividends paid after the election, with the dividend on each share determined as the candidate’s fraction of the popular vote times $2.50. Since Rest-of-Field covered all third-party candidates who earned votes in the election, the vote shares summed to 1 across the four candidates, and the total dividend paid on a basic portfolio of one share in each candidate just matched the fee charged for that portfolio. This investment/payoff rule was adopted for the IPSM because it provides a direct translation of market prices into estimates of vote shares,
expected vote share = price/$2.50
and thus offers a prediction of not only the election winner, but also the margin of victory.
Anatomy of an Experimental Political Stock Market
Despite having only 16,498 total trades in its 1988 Presidential vote share market, IPSM traders hit the nail on the head. They correctly predicted the Bush vote share (53.2%) and were only 0.2% below Dukakis’ actual percentage (45.2% instead of 45.4%). The 192 IPSM traders were more accurate than the pollsters in the election, and 1988 was a relatively good year for polling.
A no-action letter was granted in 1992 by the Commodity Futures Trading Commission for operating markets for the Democratic Presidential nomination and the Presidential Election that year. It had the desired effect of increasing participation beyond the University of Iowa:
On the eve of the November 1992 U.S. election, 1102 traders were registered to trade with a total investment of approximately $83,000. On the eve of the November 1994 election, 3,150 individuals had trading rights in the political markets with a total investment of approximately $42,000.
What Makes Markets Predict Well? Evidence from the Iowa Electronic Markets
Iowa Electronic Markets
The following year a second no-action letter (1993) was granted for the “Iowa Electronic Markets,” which would operate three categories of markets: political candidates, corporate earnings, and economic indicators. The political market would be capped at 2,000 traders and “primarily, but not exclusively” composed of students, faculty, and staff at participating universities. The latter two markets would be limited to participating universities and 1,000 traders each. All markets are limited to $500 per trader. IEM operates under this no-action letter to this day.
To give you an idea of how much it has evolved, here is the IEM user interface from 1997 and an old slideshow on the IEM Microsoft share price market
Collaborations
Below were looking at IEM’s various collaborations. This is not every partnership during the quarter-century we’re examining, but some of the more interesting projects it participated in.
Austrian Nationalratswahlen Market & Austrian Electronic Markets
IEM partnered with the Vienna University of Technology in the late 1990s for prediction markets under various names, including the IEM Austria EU-Wahl Market, later known as the Austrian Electronic Markets.
Due to difficulties with early internet connections the Austrian Electronic Market was eventually run locally but built on IEM’s software.
German Election Markets Workgroup
The German Election Markets Workgroup was a collaboration between IEM and four German universities: University GH of Essen, Dresden University of Technology, Humbolt University of Berlin, and University of the Bundeswehr Hamburg. The German Election Markets Workgroup organized the following markets from 1998 to 2000:
- Hesse state election 1999
- German European Parliamentary Election 1999
- Coalitions of national members in the EP Election 1999
- Saxony state election (September 19, 1999)
- Election for CDU chairmanship (April 10, 2000)
While IEM hosted, the universities organized the markets in their own exchanges:
- Berlin Election Exchange (Berlin)
- Dresden Electronic Markets (Dresden)
- Wahlbörse zur Europawahl 99 (Essen)
The Dresden Electronic Markets (DEM) organized the following two markets in 2000:
- German inflation rate WTA. (According to Professor Michael Berlemann, “44 traders participated in the market, most of which were students of economics and business administration at Dresden University of Technology.”
- Yield spread on German and Russian government bonds
In the beginning of 2001, DEM moved over to its own software, but continued cooperation with IEM.
Public Economics Laboratory (LAEP) of the University of Paris
IEM collaborated with both the LAEP (Public Economics Laboratory) of the University of Paris and CEDS (European Center for Scientific Diffusion) for a market on the French European Parliament elections on June 13, 1999.
IEM 2000 Taiwan Election Markets
Two election markets were created for the 2000 Taiwan Presidential election in collaboration with The Center for Chinese Electoral Studies at Duke University. (Taiwan info page)
Iowa Electronic Markets Italia
The University of Eastern Piedmont worked with IEM on two markets for the May 13, 2001, Italian general election.
UniversitetsBørsen
Founded by Martin Paldam from Aarhus University, UniversitetsBørsen (“University Stock Exchange”) was a Danish experimental stock exchange that collaborated with IEM on three markets related to the Danish elections of 2001:
- The political parties’ vote share
- Date of holding the next general election
- Prime Minister after the next general election
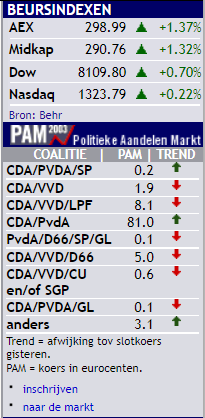
Politieke Aandelenmarkt (PAM)
From 2001 to 2003, IEM partnered with the Dutch newspaper De Volkskrant on PAM (“Political Stock Exchange”). The exposure from working with a newspaper led to more activity than normal; three of IEM’s top five markets since 1998 were Dutch elections from this period. Here’s an example of a widget on the front page of De Volkskrant’s website from February 3, 2003 (in Dutch and an English translation):
It’s not clear why the collaboration stopped, but there were reports of technical issues that led to PAM being temporarily shut down. When De Volkskrant looked to restart PAM several years later, IEM recommended NewsFutures (now called Hypermind) to relaunch the platform.
Hurricane Futures Market at the University of Miami
The Hurricane Futures Market (HFM) was a collaboration between IEM and the University of Miami from 2005 to 2007 to predict where a hurricane would make landfall. There were 29 markets for hurricanes and participation was closed to meteorology researchers and students. The ‘invite only’ nature is likely why there were only 45 traders in HFM.
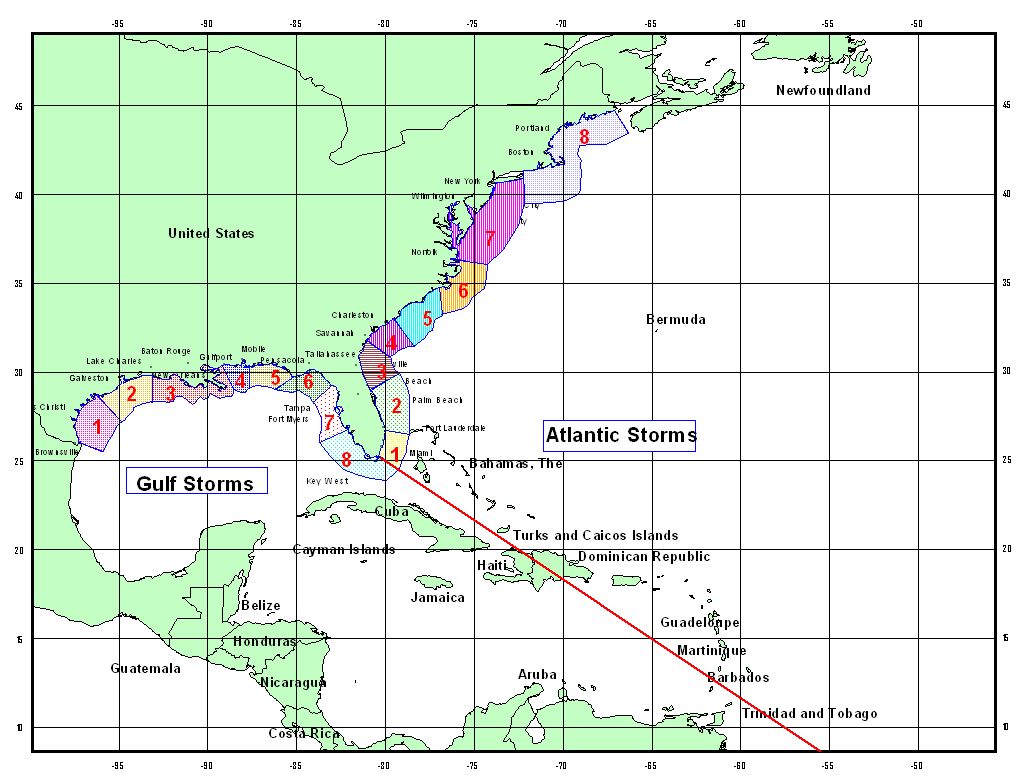
Interestingly, there were two separate markets (Market IDs 102 &103) for Hurricane Katrina because HFM had separate markets for storms in the Atlantic Ocean and Gulf of Mexico (see map above) and Katrina originally hit the Atlantic coast of Florida before moving across the Everglades into the Gulf, before destroying New Orleans.
As with election forecasting, hurricane traders were highly accurate:
Indeed, traders correctly predict a hurricane will or will not make landfall in one of eight Gulf or Atlantic regions with 84% accuracy. The most accurate forecast, the NHC forecast, correctly predicts whether or not a hurricane will make landfall in one of eight regions with 81% accuracy. Traders are more accurate than the NHC for storms more than five days from landfall (69% to 54%), but less accurate for storms two days or less from landfall (90% versus 100%).
Evolution of subjective hurricane risk perceptions: A Bayesian approach
Iowa Health Prediction Market (aka Iowa Electronic health Market)
The Iowa Health Prediction Market, later called the Iowa Electronic health Market (IEhM), was “a joint research project involving the Carver College of Medicine and the Tippie College of Business at the University of Iowa.” From 2004 to 2008, these health markets were housed at IEM before IEhM moved to its own trading platform built by NewsFutures in 2009. The data from 2009 onward doesn’t appear to be available, but from the data before then there have been 213 “Health” markets, of which 205 were about weekly Flu cases; the remaining markets were about vaccine effectiveness, MRSA, or the avian flu.
As with the hurricane markets, participation was ‘invite only’ and restricted to related medical and public health experts:
- Flu market restrictions: “Participation is restricted to registered traders, and registration is by invitation only. Invitations will be extended to members of the medical community and others who may have particular expertise with influenza.”
- Avian Flu market restrictions: “We recruit doctors, nurses, researchers, epidemiologists, public health and other medical workers who have some knowledge of avian influenza activity. Traders in the avian influenza market will be members of the Program for Monitoring Emerging Diseases (ProMED). Each of the traders is given an educational grant of with which to trade.”
IEHM also offered prediction markets for both Syphilis and H1N1 Swine Influenza. There is mention of a mumps market ‘coming’ but no sign in archives of it ever launching.
Great Expectations Project
As part of the “Great Expectations Project,” IEM partnered with The Philadelphia Inquirer and the University of Pennsylvania’s Project on Civic Engagement, based at the Fels Institute to host winner-take-all and vote share markets for the 2007 Philadelphia Democratic Mayoral Primary.
MinnPost.com Partnership
IEM teamed up with MinnPost.com for two markets in the 2008 Minnesota Senate race (winner-take-all and vote share). Unlike the partnership with de Volkskrant, MinnPost.com doesn’t seem to have heavily promoted the two Minnesota Senate markets. No mention of it was found in archives and an IEM press release from October before the election doesn’t mention MinnPost.com.
Overview of IEM Markets
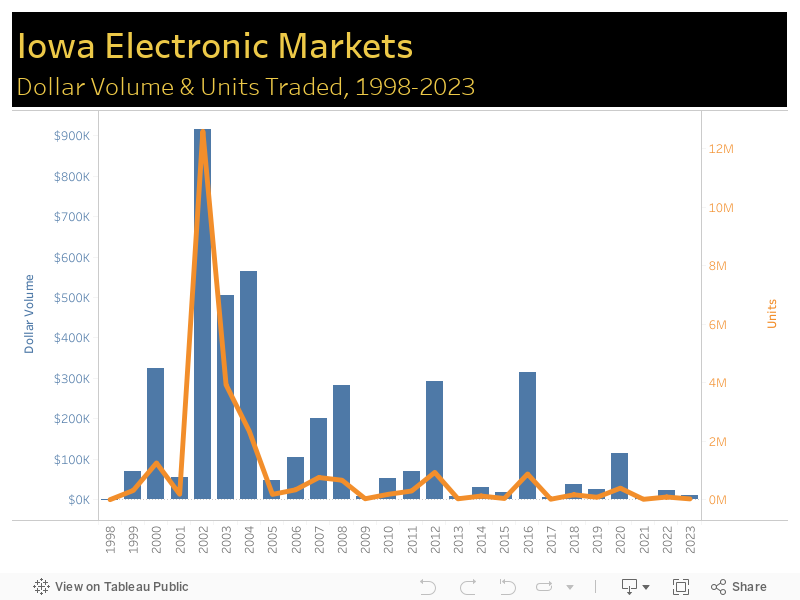
In the IEM data archives, there are 422 Market IDs for various markets going back to November 1998:
- 380 markets that were used for trading.
- 6 missing markets (ID # 9, 38, 39, 40, 382, 387)
- 36 training, test, or canceled markets
These numbers are not exact. The six markets couldn’t be found through IEM’s website although they may exist. Also, a test market could have been accidentally classified as active, and vice versa. It’s also possible the full range of trading activity was not captured from the active markets.
Markets limited to trading by experts like HFM or IEhM are included even though they had very limited trading. “Classroom” markets are included even though they were not open to the public. These include economic markets (IntInd & Index) and movie openings (The Matrix, Sleepy Hollow, and others.)
“Days” doesn’t reflect trading activity, only the days the market was open for trading (public or private.) At least one classroom movie market was seemingly kept open months after it should have been closed. Overall, markets averaged 143 days of trading.
A table of market metadata (ID, Code, Title, Years, and Prospectus) can be found here.
Here is a table of market data broken down by subject:
| Category | Dollar Volume | Markets | Units | Units/Market |
| Economic | $371,061.712 | 15 | 1,309,192 | 87,279 |
| Election | $3,653,045.765 | 101 | 24,430,091 | 241,882 |
| Health | $44,360.225 | 213 | 125,149 | 588 |
| Hurricane | $5,443.298 | 29 | 34,836 | 1,201 |
| Movie | $10,580.829 | 22 | 51,884 | 2,358 |
| Total | $4,084,491.829 | 380 | 25,951,152 | 68,293 |
These are large numbers, but they cover roughly 25 years: November 9, 1998, through January 13, 2024. To put IEM’s volume in context, PredictIt trades 10x as many shares each year (at least before the CFTC tried to shut it down) according to experts.
Top 5 Markets of all-time by dollar volume:
| Market | Market ID | Category | Contracts | Dollar Volume | Units | Days |
| NLCoalitie03 | 63 | Election | 9 | $ 337,427.692 | 2,673,801 | 188 |
| Pres04_WTA | 78 | Election | 6 | $ 327,384.904 | 1,106,722 | 163 |
| NLTweedeKamer | 57 | Election | 12 | $ 321,463.045 | 6,621,202 | 123 |
| NLPremier | 56 | Election | 10 | $ 278,761.891 | 3,038,327 | 191 |
| FedPolicyB | 51 | Economic | 302 | $ 273,353.498 | 982,708 | 5,917 |
Three things are immediately noticeable:
1) Three of the top five markets are about Dutch elections from 2002 and 2003. Candidate Pim Fortuyn was killed nine days before the 2002 elections, the first time in 330 years that a Dutch politician was assassinated in peacetime. Partnering with a newspaper plus the shocking tragedy seems to have driven trading activity above what might be expected. Indeed, 3.2 million units were traded on the NLTweedeKamer (Dutch House of Representatives) market in the 10 days between Fortunyn’s assassination and the election. However, it doesn’t explain the high volume (over 5.4 million units traded) in the 3 markets for the 2003 Dutch elections.
2) FedPolicyB only makes the list because of the market’s longevity (2001-2023); think of it as the Craig Biggio of prediction markets.
3) The only US Presidential market to make the list (Pres04_WTA) is from 2004. In the chart below, after 2004 trading activity is minimal outside of presidential election years, and even then, there is a significant drop from the 2004 to 2020 elections.
Accuracy
In another article, we’ve compared IEM’s accuracy to Ray Fair’s economy-driven election model in forecasting the two-party vote share in presidential elections (IEM was slightly more accurate.)
From the initial Iowa Presidential Stock Market in 1988 through the 2008 presidential election, IEM consistently outperformed the polls:
The results above suggest that predictions from markets dominate those from polls about 75% of the time, whether the prediction is made on election eve or several months in advance of the election. To assess the size of the advantage in addition to its frequency, we computed the average absolute error for both polls and markets on each day a poll was released. The mean error for polls across all 964 polls in the sample was 3.37 percentage points, while the corresponding mean error for market predictions was 1.82 percentage points. That advantage persisted for both long term and short term forecasts. Using only those dates more than 100 days prior to the election, the poll error averaged 4.49 percentage points and the market error averaged 2.65 percentage points. Polls conducted within 5 days of the election had an average error of 1.62 percentage points, while the corresponding market prediction error average was 1.11 percentage points.
The Future of IEM
With its Steering Committee members all over 60 years old, including Dr. Joyce Berg retiring from teaching in 2022, it’s not clear what the future of IEM will look like. In part due to the success (i.e. accuracy) of IEM, there are many other options for prediction markets and forecasting platforms today. Meanwhile, IEM as a platform has grown dated and clunky over the years.
Building technology is difficult, but IEM still has a no-action letter from the CFTC. Something Polymarket doesn’t have, Nadex and Kalshi couldn’t get, and PredictIt could potentially lose. New technology is needed, but a prediction market always seemed a natural fit for a news site like Bloomberg, The New York Times, The Economist, or Disney-ABC-FiveThirtyEight. Not just for engaging users, but for price discovery and risk management that their various readers would need.