When we looked at The Economist and FiveThirtyEight models’ respective error over time, there wasn’t a steady downward trend toward Election Day 2020. The models both fluctuated (within a very limited range) but the Economist’s lowest Brier score was on October 3rd, and it performed better than FiveThirtyEight until the final week of the campaign.
Below we’re interested in how traders on Manifold Markets perform over time by taking probabilities daily from 1,963 markets over their respective final 30 days before the scheduled market close and calculating Log loss and Brier scores for all the 1,963 markets.
As you can see in the chart below, there is a steady decrease in error over the final month of markets:
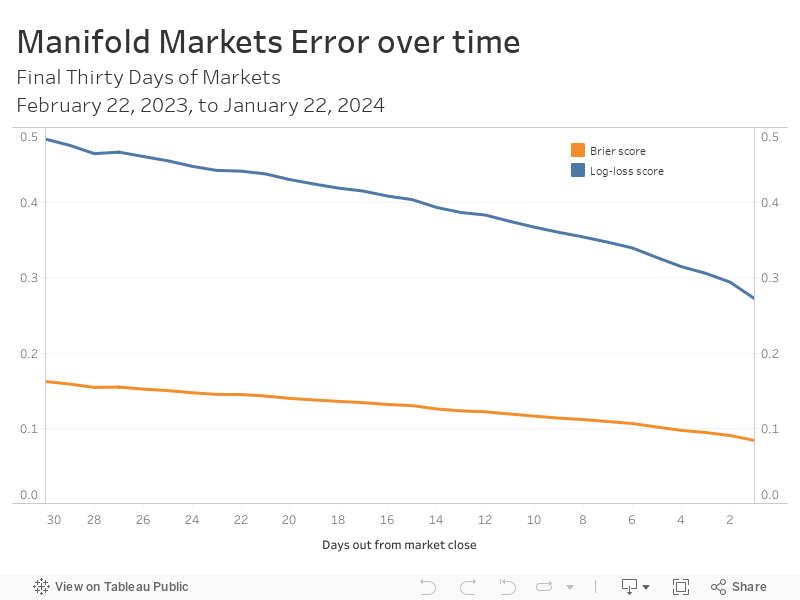
Over the 30-day period, both error metrics nearly cut in half. There was very little change day-to-day as 1,448 of the 1,963 markets (74%) had the same market probability from Day 28 to Day 27. Of the 515 that did change, 314 (61%) moved in the right direction toward the correct outcome. The increase in error was driven by drastic changes in the wrong direction by a handful of markets about the usual – if not stereotypical – Manifold subjects:
- Will Manifund announce an impact cert round with any major EA org before May?
- Will Destiny appear on Lilly’s Brush It Off Podcast in May?
- Will anybody send their Manifold API key to @EntropyBot?
- Will Tetraspace submit anything to the OP AI Worldviews Contest?
- Will Isaac King still be active on manifold a month after Whales vs Minnows
Removing those five markets would have continued the decline in error in both metrics. And it’s fitting that the Manifold’s accuracy would be hurt by two markets about Effective Altruism, two markets about Manifold itself, and one market about YouTube personality Destiny.
Scoring Rules
Brier score
The binary market outcomes (“resolution”) are quantified as either 1 (YES) or 0 (NO). The Brier score for one day of forecasts is the average of all the market errors for that day, squared.
The market error is the difference between the market’s outcome and the market’s probability for that day. That error is then squared, which has the consequence of eliminating negative values and penalizing extreme predictions. The simple mean of all these squared errors is Manifold’s Brier score. For example, given one market probability of 0.8 and its resolution NO:
(Probability – Resolution)2 = (0.8-0)2 = (0.8)2 = 0.64
Brier scores range from 0 to 1, and lower is better with 0 being a perfect score.
Log-loss score
The log-loss score is the negative average of the log of corrected predicted probabilities.
The ‘corrected predicted probability’ is the probability that the market resolved to its actual outcome, rather than just resolving to YES. So if a market has a probability of 0.3, and resolves NO, then the corrected predicted probability is 0.7.
We get the ‘log’ by transforming the ‘corrected predicted probability’ with the natural logarithm (ln). As with Brier score, the mean of all the log-losses is the log-loss score. Here is an example using the same probability and outcome as the Brier score example:
-[Resolution * ln(Probability) + (1 – Resolution) * ln(1 – Probability)] =
-[0 * ln(0.8) + (1 – 0) * ln(1 – 0.8)] =
-[ 0 * -0.22314 + (1) * -1.60944] =
-[ 0 – 1.60944] =
1.60944
Because probabilities of 1 and 0 would cause issues with the above formula, ln(0) is invalid, the market resolutions for the Log-loss score were “clipped” at 0 and 1. Resolution values of 0 (NO) were substituted with 0.00000000000001 and 1 (YES) with 0.99999999999999.
As with Brier scores, lower is better with 0 being a perfect score. But unlike Brier scores, log-loss scores range from 0 to infinity.
Methodology
There were 100,147 markets created on Manifold Markets as of January 22, 2024, at 1:10 pm ET. Only 63,951 markets were resolved at that point. Of those resolved markets, only 54,072 were binary. Of those resolved binary markets, only 48,050 had a YES or NO resolution (they weren’t canceled or resolved as a percentage.)
We’re using 11 months of daily market data ending on January 22nd. Markets were excluded where the market close was moved or were resolved before the scheduled close date. (i.e., “Will Donald Trump say X” has a schedule close, but resolves when Trump says X.) After filtering down to markets with at least a 30-day window before the scheduled close time, we’re left with 9,041 unique markets.
Looking at only markets where we have all thirty days of probability data leading up to the scheduled market close only leaves us with 2,052. Now 89 of those markets had the respective market close moved forward or backward at some point, and excluding those leaves us with 1,963 markets to examine.
Please note that the data is messy. For example, we’re missing 13 days (using 323/335 days in that period) which is a bigger headache than at first glance because we’re using 30 continuous days of market data; if one day out of 30 is missing then that market is excluded. And the market data was captured at inconsistent times on each day. Generally, it was saved around mid-morning, but not always.
Further analysis
This admittedly is a shallow analysis of interesting data. Some future, and hopefully more interesting, analyses could include:
- How far out from the scheduled market close do the market probabilities become a coin flip?
- Relationship between volume and accuracy.
- How does accuracy vary by market topic/subject?
- Accuracy of markets with unscheduled closure and resolutions.
Python code and market data can be found here.