Kalshi turns three years old today, and the past year has been a rollercoaster for the exchange:
- The CFTC reviewed Kalshi election contracts.
- The CFTC rejected said election contracts.
- Kalshi (currently) is suing the CFTC.
- The CFTC (currently) is attempting to ban all election contracts.
- Hot dog markets.
- Someone gave the Kalshi Twitter account password to the new intern.
- Kalshi at Manifest 2024.
Previously we took a looked at Kalshi for its one-year and two-year anniversaries, and now we’re again taking a look at the exchange’s growth since we last checked in.
Top markets by trading volume
Previously limited to markets with over 500,000 shares traded. Over the first year of its existence, only five markets broke that threshold. By the end of the second year, 17 (+12) markets had volume over 500,000. By its third birthday today, Kalshi now has 60 (+43) markets over that number.
To make this a little more manageable, we’re going to raise the bar to $1 million, and only look at volume over the past 12 months.
Here are the 19 markets that broke a volume of 1,000,000 shares traded over the past 12 months:
| Market | Summary | Volume |
| NASDAQ100Y-24DEC31-B12250 | Nasdaq price range at the end of 2024 | 4,284,608 |
| INXD-24DEC31-B3300 | S&P price range at the end of 2024 | 3,609,071 |
| INXD-24DEC31-B5700 | S&P price range at the end of 2024 | 3,347,263 |
| INXY-23DEC29-B3800 | S&P price range at the end of 2023 | 2,449,616 |
| NASDAQ100Y-23DEC29-B13250 | Nasdaq price range at the end of 2023 | 2,349,429 |
| INXD-24DEC31-B3700 | S&P price range at the end of 2024 | 2,323,164 |
| NASDAQ100Y-24DEC31-B12750 | Nasdaq price range at the end of 2024 | 2,301,547 |
| INXD-24DEC31-B3500 | S&P price range at the end of 2024 | 2,273,026 |
| NASDAQ100Y-24DEC31-B13750 | Nasdaq price range at the end of 2024 | 1,782,890 |
| RATECUT-24JUN12 | Fed rate cut by June 2024 | 1,780,280 |
| RATECUT-24JUL31 | Fed rate cut by July 2024 | 1,446,416 |
| INXY-23DEC29-B5200 | S&P price range at the end of 2023 | 1,370,911 |
| FED-24JUN-T5.25 | Fed Funds rate in June 2024 | 1,349,824 |
| NASDAQ100Y-24DEC31-B13250 | Nasdaq price range at the end of 2024 | 1,277,093 |
| INXD-24DEC31-T5799.99 | S&P price range at the end of 2024 | 1,240,813 |
| NASDAQ100Y-23DEC29-B12750 | Nasdaq price range at the end of 2023 | 1,155,514 |
| INXD-24DEC31-B3900 | S&P price range at the end of 2024 | 1,152,403 |
| RATECUT-24MAY01 | Fed rate cut by May 2024 | 1,108,591 |
| NASDAQ100Y-24DEC31-B14250 | Nasdaq price range at the end of 2024 | 1,018,353 |
The yearly market close events are still the most traded, comprising 15 of the top 19 markets by volume. The remaining four are all centered on potential Federal Reserve rate changes.
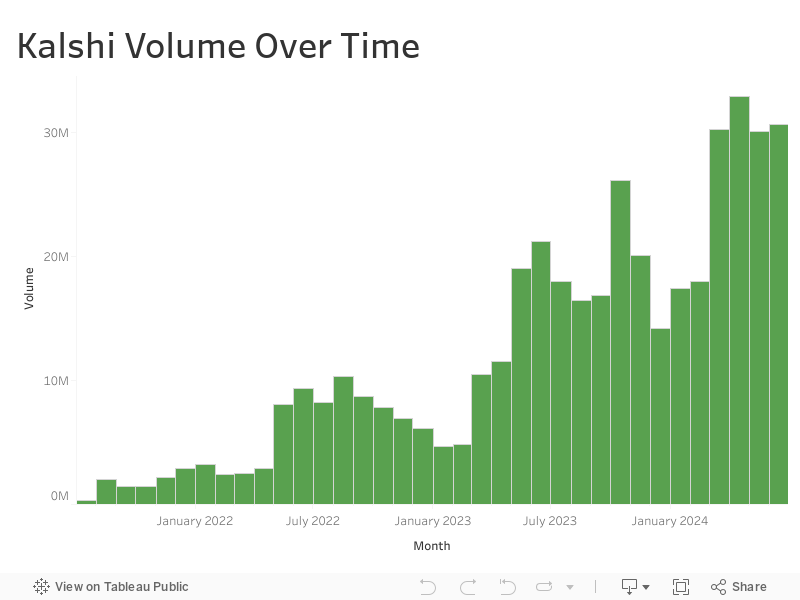
Kalshi year-over-year
| Period | Volume |
| Year One (21-22) | 38,749,075 |
| Year Two (22-23) | 119,700,082 |
| Year Three (23-24) | 270,730,577 |
| Total | 429,179,734 |
Kalshi is still experiencing rapid growth, more than doubling trading volume year-over-year.
Growth Drivers
The top 5 events account for 50% of Kalshi volume in Year Three:
| Event | Summary | Volume |
| INXD | Daily S&P close price range, through Jan 19, 2024 | 38,721,350 |
| INX | Daily S&P close price range, beginning Jan 22, 2024 | 31,441,542 |
| NASDAQ100Y | Nasdaq price range at the end of the year | 22,237,907 |
| NASDAQ100 | Nasdaq price range at the end of the day, beginning Jan 22, 2024 | 21,861,594 |
| NASDAQ100D | Nasdaq price range at the end of the day, through Jan 19, 2024 | 20,975,751 |
And these were really just three events as Kalshi switched naming conventions for daily markets in January 2024.
For anyone interested, Kalshi Market Data and Trade Data are publicly available.