We previously looked separately at both The Economist’s and FiveThirtyEight’s respective 2020 presidential models in the months leading up to the 2020 Presidential Election, and are now directly comparing their state-level predictions. This is challenging because the models made different predictions.
The Economist’s model made forecasts in all 50 states plus Washington, D.C., while FiveThirtyEight’s model predicted those same 51 outcomes, as well as the five Congressional districts that assign Electoral College votes: Maine-1, Maine-2, Nebraska-1, Nebraska-2, Nebraska-3. You can read about why The Economist didn’t include the five congressional districts here.
For an apples-to-apples comparison, we’re only using the overlapping predictions (50 states and D.C.) from each model. This is arguably unfair to FiveThirtyEight since they were brave enough to tackle those five congressional districts (even if those predictions didn’t perform too well.)
While FiveThirtyEight has a running list of every day’s predictions, The Economist only releases outputs for that particular day. We were only able to capture 79 of the final 80 days (missing August 27) of The Economist’s model outputs, and so we’re only comparing those 79 days between the two models. Each model releases a great deal amount of data and predictions in each output, but we’ll specifically be comparing state-level predictions about Biden’s chance to win in each state using The Economist’s “projected_win_prob” and FiveThirtyEight’s “winstate_chal.”
Below we’re going to compare both models over time using their Brier scores, predicting state winners, extreme predictions, and daily volatility.
BRIER SCORES
We’re using Brier Score to measure each model’s respective outputs. Truth is quantified as either 0 (Biden did not win state) or 1 (Biden did win state). For each prediction, the error is defined as the difference between the truth and the model’s probability of Biden winning. The mean of all the squared errors makes up a model’s Brier score. Brier scores range from 0 to 1, and lower is better.
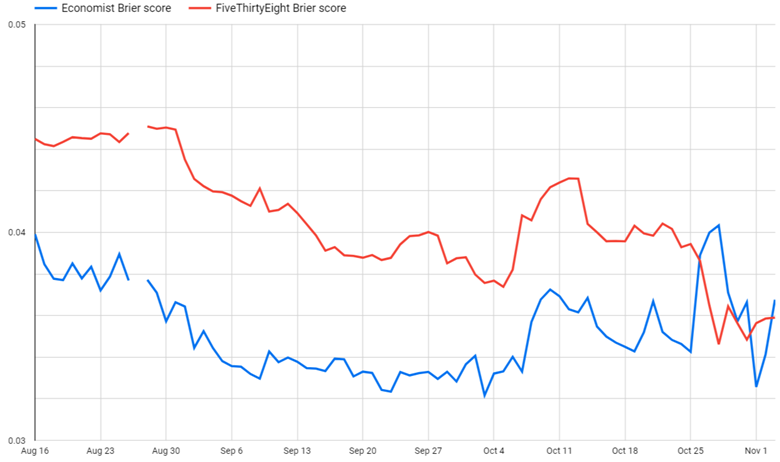
In the outputs we’re comparing, The Economist had a lower (i.e., better) Brier score on 72 out of 79 days. It wasn’t until the final week of the campaign that FiveThirtyEight’s model began to achieve lower Brier scores than The Economist.
Both models’ Brier scores were relatively close together, always within 0.01 of each. The closest the scores came was on October 30, when they were only apart by 0.000096 and the farthest was on August 30th when they were separated by 0.009319.
As seen in the chart above, both models’ scores seemed to flip between October 25 and 28. We’d discussed before how the spike in error in The Economist’s model on October 28 was driven by extremely wrong forecasts in three states. FiveThirtyEight also incorrectly predicted Biden to win those same three states on October 28, but was much less confident about his chances:
| Candidate | State | FiveThirtyEight | Economist |
| Biden | Florida | 0.618275 | 0.792575 |
| Biden | Iowa | 0.50375 | 0.563725 |
| Biden | North Carolina | 0.643925 | 0.7294 |
PREDICTING STATE WINNERS
Out of the 4,029 total predictions we’re measuring (79 days of model outputs x 51 predictions), The Economist and FiveThirtyEight agreed on the state winner in 3,980 predictions.
Using a threshold of 0.5 to define which candidate was predicted to win a state, FiveThirtyEight and The Economist were forecasting the same state winner in all 51 contests in 35 out of 79 days. In fact, they never predicted different winners in more than two states at a time. The three states where they differed were:
- Georgia: 12 days (Oct 8-11, Oct 15-18, Oct 23, Oct 29-31)
- North Carolina: 16 days (Aug 16-Sep 1; Aug 27 is missing)
- Ohio: 21 days (Sept 24-Oct 4, Oct 6-9, Oct 10-14, Oct 29)
In Georgia, The Economist had Biden winning Georgia on four days (Oct 8-11) where FiveThirtyEight predicted Trump. On the other eight days (Oct 15-18, Oct 23, Oct 29-31) they differed in Georgia, FiveThirtyEight predicted Biden and The Economist, Trump. Between October 31 and November 1, The Economist’s output for Biden’s probability of winning jumped from 0.462725 to 0.565925, and both models predicted the same winners and losers (rightly and wrongly) for the last three days of the campaign.
In North Carolina, FiveThirtyEight had Trump winning North Carolina in 16 out of the 79 total days of predictions compared, while The Economist had Biden winning in all 79 predictions.
In Ohio, FiveThirtyEight predicted Biden to win Ohio on those 21 days where the model outcomes differed. The Economist had Trump winning Ohio all 79 days measured, with Biden’s probability never rising above 0.47925 (August 25.)
Both models made the same incorrect predictions on Election Day, missing Florida and North Carolina. The Economist had Biden winning Florida in every model prediction captured from August 16th onward, with his win probability never dropping below 0.65. FiveThirtyEight also had Biden winning Florida wire-to-wire, with Biden’s win probability never falling below 0.5498.
EXTREME PREDICTIONS
Over the 79 days of predictions compared, The Economist consistently had more certain (or extreme) predictions than FiveThirtyEight. By “more certain,” we mean that The Economist’s predictions were consistently farther from the middle (i.e., 0.5) than FiveThirtyEight’s predictions. When both models predicted Biden to win a state, The Economist’s model consistently gave him a higher probability to win, and when both models predicted Biden to lose, The Economist consistently gave him a lower probability to win than FiveThirtyEight.
In the 3,980 state-level predictions where both models agreed on the state winner, The Economist was more certain than FiveThirtyEight in 3,671 predictions (92%), less certain in 230 predictions (6%), with the remaining 79 predictions being for D.C., where both models were equally and absolutely certain that Biden would win.
In every state, The Economist had most of the more certain predictions. Among states where both models agreed on the winner in every output, Virginia (38/79) and Arizona (37/79) were the states where FiveThirtyEight came the closest to parity with The Economist in terms of having more extreme predictions.
On Election Day, FiveThirtyEight’s predictions were almost all more conservative (or less certain) than The Economist. The two exceptions are D.C. where both models had absolute certainty of Biden winning, and Iowa where both models favored Trump, but The Economist (0.450525) gave Biden a higher probability of winning than FiveThirtyEight (0.3987).
DAY-TO-DAY VOLATILITY
Using standard deviation to measure daily volatility over the 79 captured days, we see that FiveThirtyEight’s predictions had higher volatility than The Economist in 45 of the 51 state-level predictions. Both models have zero variance in D.C. (where they predicted Biden to win the entire time), while The Economist’s predictions were more volatile in Iowa, North Carolina, Ohio, South Carolina, and Texas. Both models had the highest daily volatility in swing states: Georgia, Iowa, Minnesota, New Hampshire, North Carolina, Pennsylvania, and Wisconsin.
In the 51 predictions examined over 79 days, there were only 14 instances where a state-level probability changed by greater than 0.1 over one day. All occurred in the last 10 days of the Election, and 13 of the 14 were by The Economist.
| Model | State | Date | Change in Biden Prob. |
| Economist | Arizona | October 29 | -0.11565 |
| Economist | Georgia | November 1 | +0.1032 |
| Economist | Iowa | October 26 | +0.103825 |
| Economist | Iowa | October 29 | -0.212675 |
| FiveThirtyEight | Iowa | October 31 | -0.100675 |
| Economist | Michigan | October 29 | -0.111225 |
| Economist | Michigan | November 1 | +0.11625 |
| Economist | New Hampshire | November 1 | +0.102375 |
| Economist | North Carolina | October 29 | -0.148925 |
| Economist | North Carolina | November 1 | +0.120575 |
| Economist | Pennsylvania | October 29 | -0.120175 |
| Economist | Pennsylvania | November 1 | +0.111475 |
| Economist | Wisconsin | October 29 | -0.11855 |
| Economist | Wisconsin | November 1 | +0.128925 |
In four instances (Michigan, North Carolina, Pennsylvania, and Wisconsin), The Economist’s model seems to be correcting its October 29 output on November 1. We could probably include Arizona and New Hampshire in this group as well, because Biden’s probability in Arizona increased on November 1 (+0.090675) and his probability in New Hampshire decreased on October 29 (-0.09685).
In every state but North Carolina, the final large daily change moved Biden’s probability closer to the correct outcome.
CAVEATS
The point of this article is to explore the different – and very similar – outputs of both models. We’re not trying to judge one model as being “better” or “worse” than the other. Please keep in mind the following:
- The data is only limited to these 79 daily predictions and there is missing data from August 27.
- FiveThirtyEight predicted the five congressional districts, while the Economist did not, and none of those predictions were used.
- By Election Day both models had identical state-level winners predicted.
- Model outputs very well could have been correct at the time predicted and political circumstances changed afterward making them obsolete.
- This analysis only uses one scoring rule, Brier score, and both models’ scores were very close together. The x-axis in the chart above only goes from 0.03 to 0.05 in a total possible range from 0 to 1.
ADDITIONAL ANALYSIS
Future analysis could measure accuracy using different scoring rules and explore the correlation of state-level predictions between the two models.