We previously looked at Brier scores for The Economist’s 2020 Presidential model predictions over time, and surprisingly found the scores worsened closer to Election Day. Given the closeness of their predictions, I assumed FiveThirtyEight’s Brier scores would trend the same way but was wrong again.
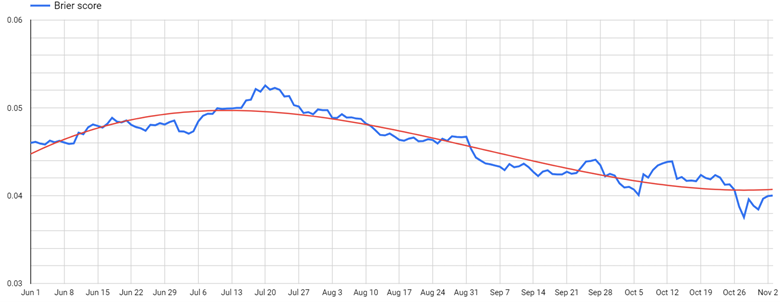
In the chart below you can see Brier scores for FiveThirtyEight’s Presidential model from June 1st to November 3rd in blue with a trend line in red:
Brier scores measure probabilistic predictions for binary outcomes, in this case the probabilities from FiveThirtyEight’s 2020 Presidential model. Truth is measured as either 0 (event did not happen) or 1 (event did happen). For each prediction, the difference between the truth and the model’s probability of the event happening is the error. The mean of all the squared errors makes up a model’s Brier score. Brier scores range from 0 to 1, and lower is better.
Please note that FiveThirtyEight and The Economist’s models predicted different events and so we shouldn’t directly compare their Brier scores. FiveThirtyEight’s model made 56 predictions (all 50 states, D.C., and the Maine and Nebraska Congressional Districts), while The Economist only made 51 (all 50 states and D.C.)
The highest (worst) Brier score was July 20th (0.0526) and the lowest (best) score was October 28th (0.0375). Using a 0.5 threshold for predicted probabilities, FiveThirtyEight’s worst Brier score from July 20th had 53 out of 56 predictions correct but it’s best Brier score from October 28th only had 52 out of 56 predictions correct.
Comparing the models with the highest and lowest Brier scores:
- The “best model” was wrong in Florida, North Carolina, Iowa, and Maine-2
- The “worst model” was wrong in Florida, North Carolina, and Georgia
- Wisconsin probabilities (0.21062) changed the most between the July 20th and October 28th model outputs, while West Virginia changed the least (0.00045)
Overall, FiveThirtyEight’s model predicted:
- Biden winning Florida wire-to-wire.
- Biden winning North Carolina except August 11th – September 1st.
- Correctly predicted Maine-2 on most days, but not for the last nine days of the campaign, including Election Day.
In the future, I’d like to show over time:
- FiveThirtyEight and The Economist’s respective Brier scores head-to-head over time for their overlapping predictions (50 states and D.C.)
- The number of state winners correctly predicted using a 0.5 threshold.
- The implied probabilities from PredictIt and British bookmakers.
- Log-loss and other scoring rules to measure predictions.